A clearer way to get started and find answers
Follow your website's setup progress in one compact place, find reports through reorganised navigation, or choose the simpler Standard menu in Display.
Website setup at a glance. A compact strip under the dashboard heading follows six parts of setup: log collection, Google Search Console, Google Analytics, sitemap, robots.txt and your first site crawl. It shows how many are complete and, separately, how many need action. Optional steps you have not started, such as a first crawl, are not counted as problems. Open the details for dates, check results and links to the right settings.
Reorganised navigation. Reports are grouped by what you want to do: Watch, Understand, Investigate and Manage, with collapsible sections inside each. Expert navigation remains the default. Prefer fewer choices? Choose Standard in Display for a simpler menu, and use Explore to find any report or look up a page.
A more compact dashboard. Setup takes less space above the traffic graph, which keeps the graph prominent and makes room for other useful information.
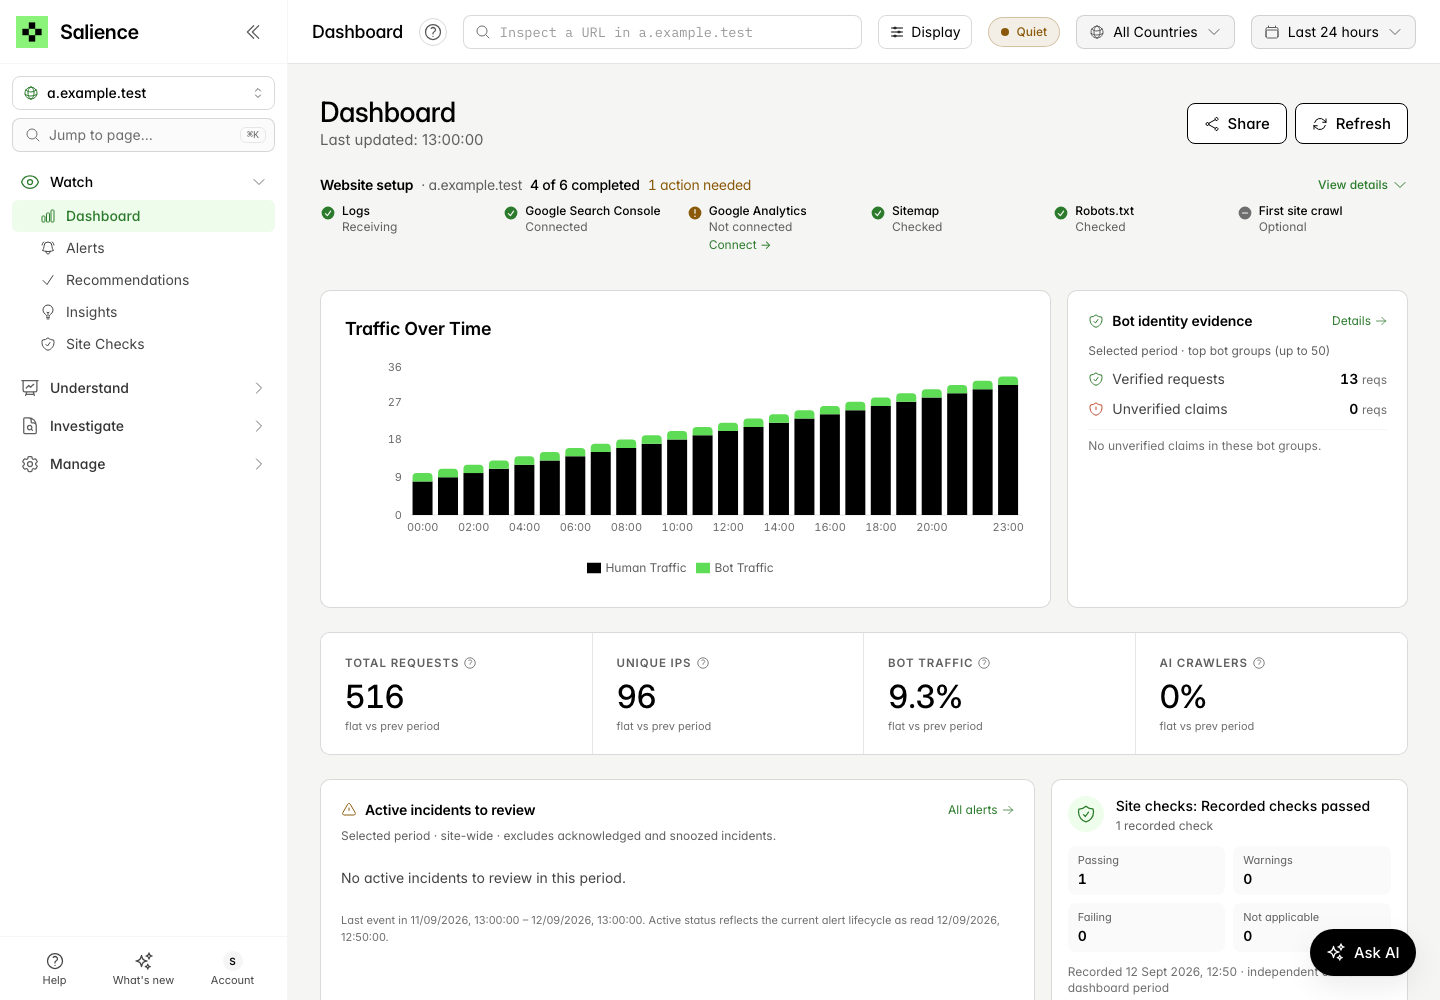
Example data.
Read more in Website setup and Finding your way around.