Help & Documentation
Everything you need to know to get the most out of LogLens.
Introduction
LogLens is a real-time web analytics and security monitoring platform. Unlike traditional analytics tools that rely on JavaScript tracking, LogLens analyzes your server logs to provide accurate, privacy-friendly insights into your website traffic.
What makes LogLens different?
- Server-side analytics — Captures all requests, including those from bots, scrapers, and users with ad blockers
- Real-time monitoring — See traffic as it happens with sub-second latency
- Bot detection & verification — Automatically identifies bots and verifies legitimate crawlers against their official IP ranges
- IP address analysis — Deep dive into individual IPs and IP ranges to identify patterns
- Smart alerts — Get notified instantly when traffic anomalies, errors, or suspicious bot activity occur
- Privacy focused — No cookies, no personal data collection, GDPR compliant by design
- Data export — Export any data table to CSV for further analysis
- Native integrations — First-class support for AWS CloudFront, Cloudflare, Vercel, and self-hosted Apache / Nginx (via the open-source Vector agent)
Quick Start Guide
Get up and running with LogLens in just a few minutes.
Step 1: Create an Account
Sign up at app.loglens.ai using your email address. You'll automatically be set up with a personal organization.
Step 2: Add Your Website
From the dashboard, click on the website selector and choose "Add Website". Enter your domain name and a friendly name for your site.
Step 3: Connect Your Logs
You have several options to send logs to LogLens:
- AWS CloudFront — Use real-time logs with Kinesis Firehose (recommended for AWS users)
- Cloudflare — Use Cloudflare Workers to forward logs
- Vercel — Use Vercel Drains for instant setup (recommended for Vercel users)
- Apache / Nginx — Install the open-source Vector agent on your server to tail the access log (10-minute setup)
- Import — Upload historical log files directly
Step 4: Configure Alerts
Navigate to the Alerts page to set up monitoring for traffic anomalies, error spikes, and suspicious bot activity. LogLens will automatically build a baseline over 24 hours and start detecting anomalies.
Step 5: View Your Analytics
Once logs start flowing, your dashboard will populate with real-time data. It typically takes 1-2 minutes for the first data to appear.
Enable "Live" mode in the top-right corner to see requests as they happen in real-time.
Key Concepts
Requests vs Visitors
LogLens tracks requests, not unique visitors. A single page load typically generates multiple requests (HTML, CSS, JS, images). This gives you a more complete picture of server load and resource usage.
Human vs Bot Traffic
LogLens automatically classifies traffic as either human or bot based on user agent analysis. Bot traffic is further categorized into:
- Search engines — Google, Bing, etc.
- Social media — Facebook, Twitter, LinkedIn crawlers
- AI crawlers — GPTBot, ClaudeBot, etc.
- Monitoring — Uptime monitors, health checks
- SEO tools — Ahrefs, SEMrush, etc.
- Scrapers — Generic or malicious bots
Verified vs Unverified Bots
Many bots claim to be legitimate crawlers (like Googlebot) but are actually impersonators. LogLens verifies bots by checking if their IP address matches the official IP ranges published by Google, Microsoft, OpenAI, and other major bot operators.
- Verified — IP matches official published ranges
- Unverified — Claims to be a known bot but IP doesn't match
Time Periods
All analytics can be filtered by time period. Available options include:
- Last hour, 6 hours, 24 hours
- Last 7 days, 30 days, 90 days
- Last year
- Custom date range
Dashboard Overview
The main dashboard provides a high-level summary of your website traffic.
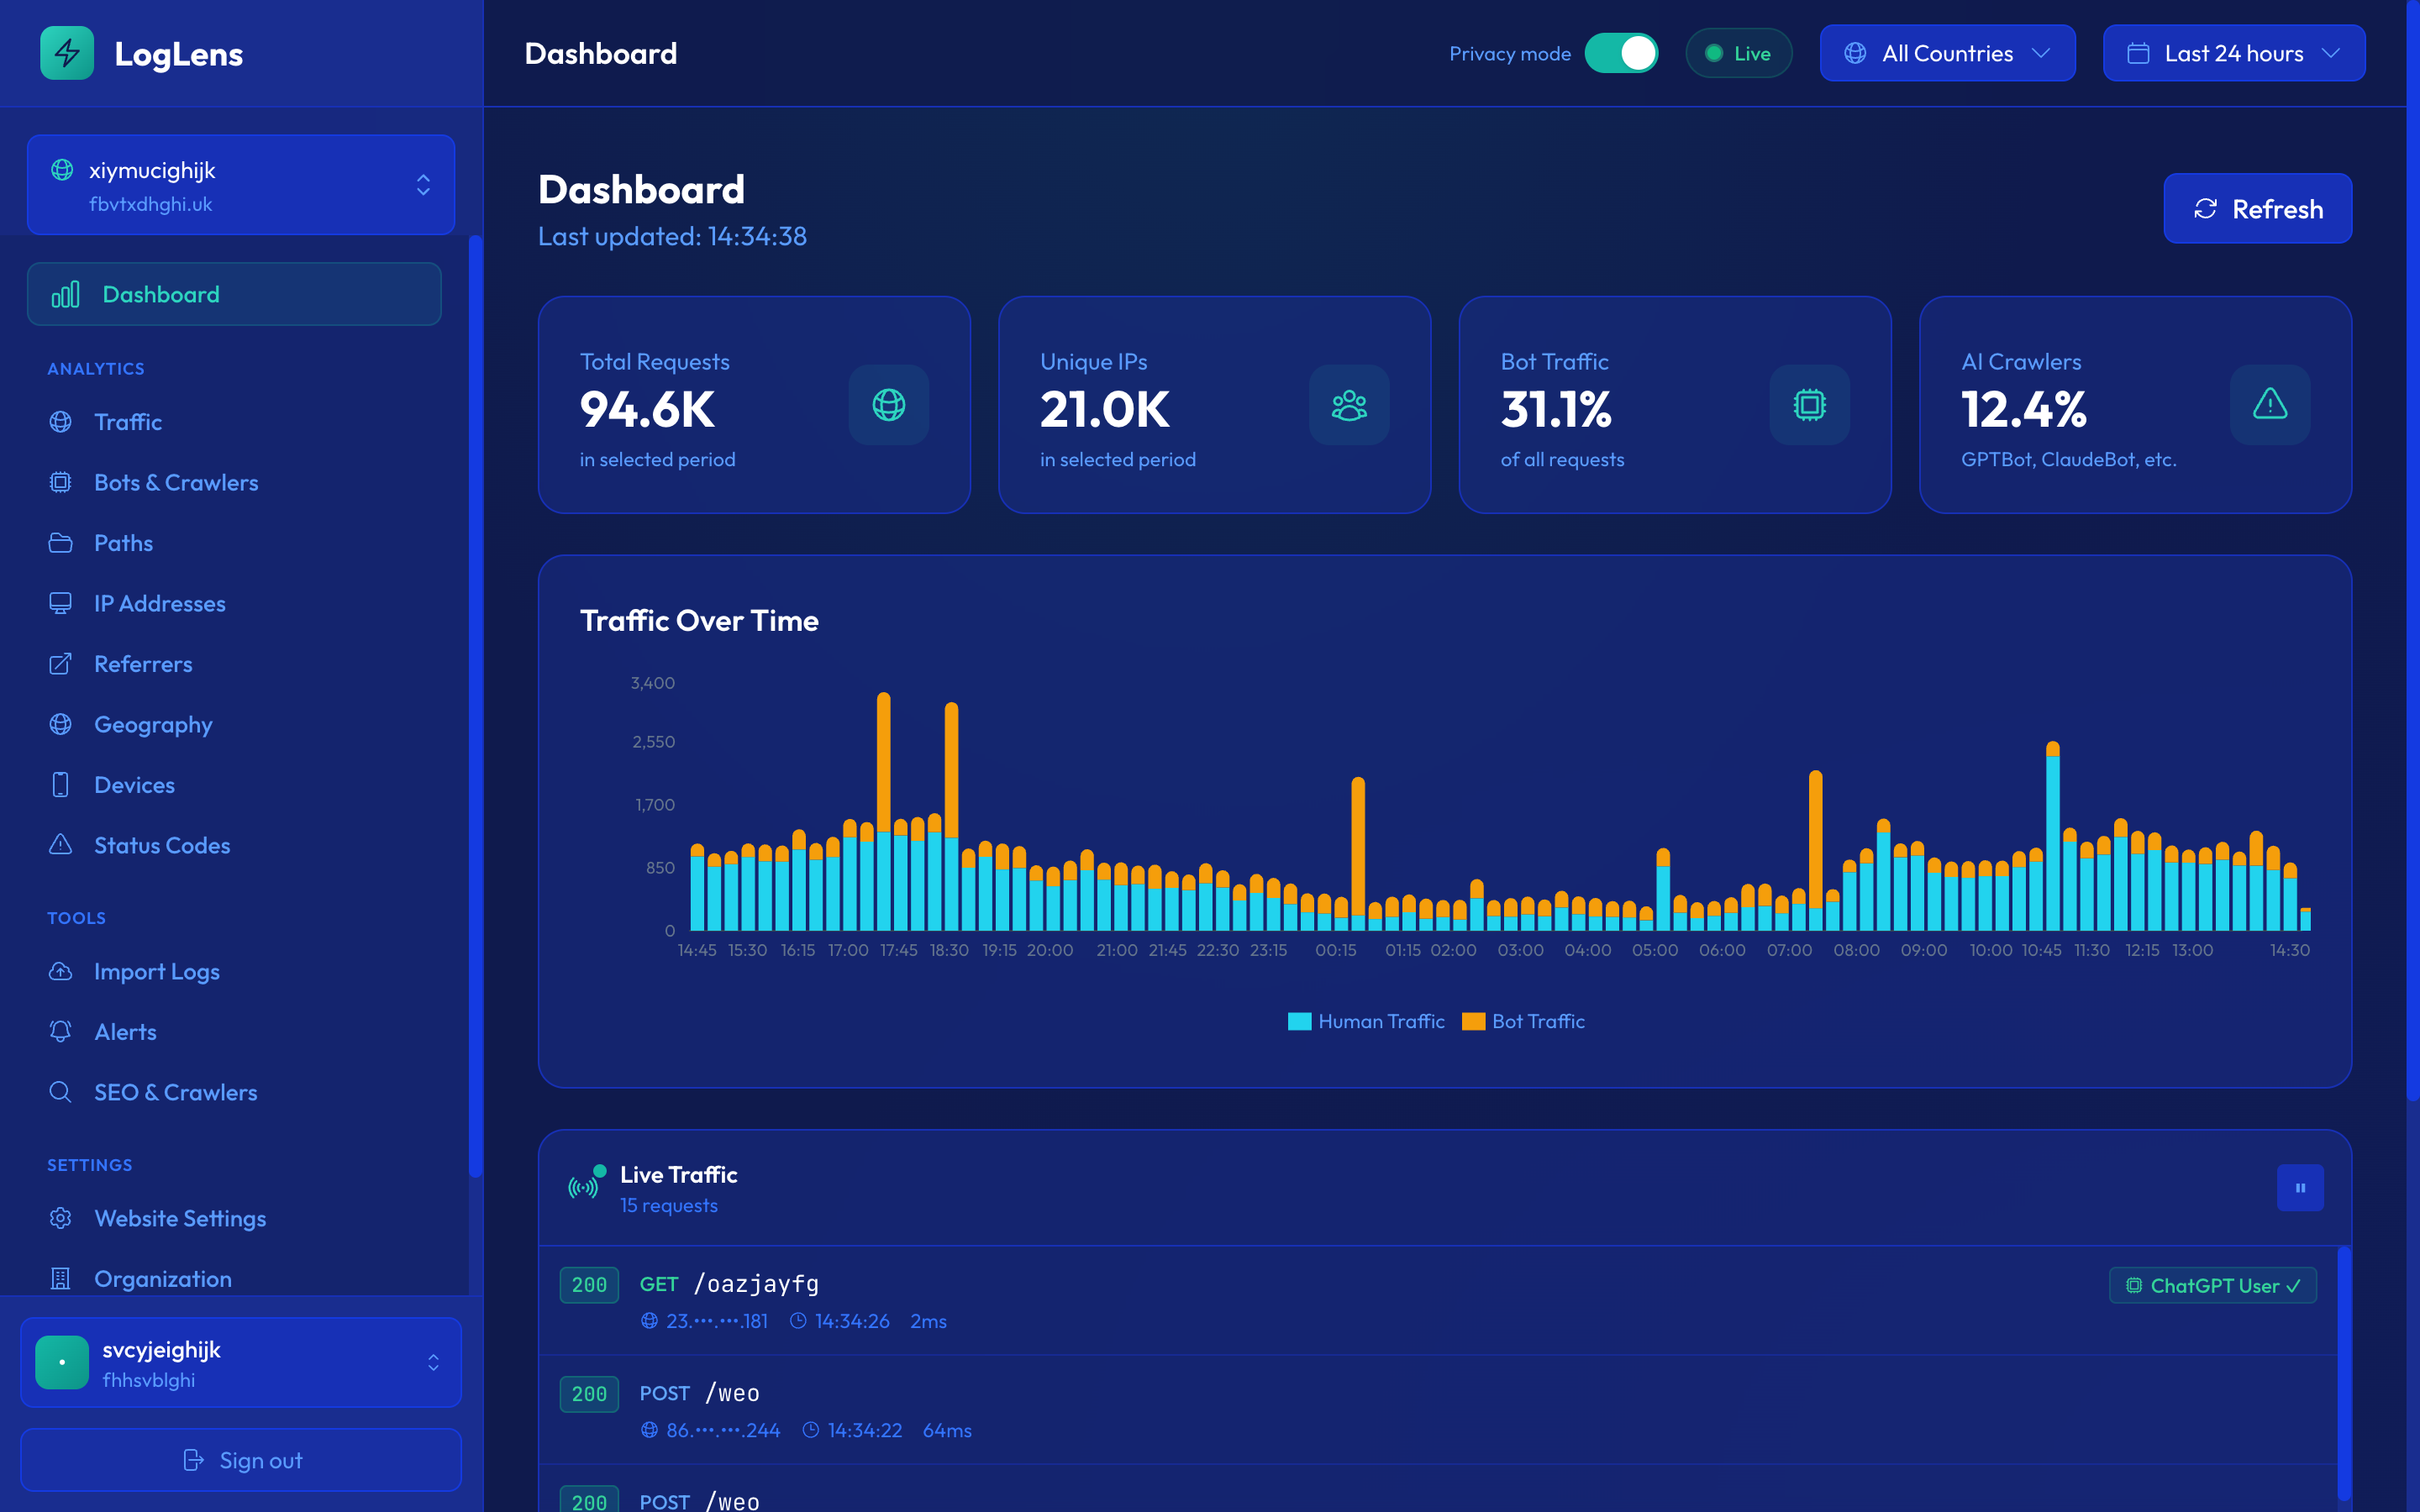
Key Metrics
| Metric | Description |
|---|---|
| Total Requests | All HTTP requests received in the selected time period |
| Human Traffic | Requests identified as coming from real users |
| Bot Traffic | Requests identified as coming from automated bots |
| Unique IPs | Number of distinct IP addresses that made requests |
Dashboard Widgets
The dashboard includes several widgets:
- Traffic over time — Bar chart showing requests per time interval
- Top countries — Geographic distribution of traffic
- Top bots — Most active bot user agents with verification status
- Top paths — Most requested URLs
- Live feed — Real-time stream of incoming requests with bot verification badges
Time Filters
Use the time filter dropdown in the top-right corner to change the analysis period.
Preset Periods
Quick selection options include Last hour, 6 hours, 24 hours, 7 days, 30 days, 90 days, and 1 year.
Custom Date Range
Select "Custom" to specify exact start and end dates. This is useful for analyzing specific events or campaigns.
Shorter time periods provide more granular data (per-minute intervals), while longer periods show daily aggregates.
Country Filters
Filter your analytics by country to focus on specific geographic regions.
How to Use
- Click the "All Countries" dropdown in the header
- Select one or more countries from the list
- All analytics will update to show only traffic from selected countries
This is particularly useful for:
- Analyzing traffic from your target markets
- Identifying suspicious traffic from unexpected countries
- Comparing behavior across different regions
Live Mode
Live mode shows requests as they happen in real-time.
Enabling Live Mode
Click the "Live" toggle in the top-right corner of the dashboard. When enabled, the dashboard will automatically refresh every 10 seconds and show a live feed of incoming requests.
Live Feed
The live feed shows the most recent requests with details including:
- Timestamp
- Request path
- HTTP method and status code
- Country of origin
- Human/bot classification
- Bot verification status (verified or suspicious)
Traffic Analysis
The Traffic page provides detailed analysis of your website requests.
Traffic Over Time
A stacked bar chart shows human traffic (cyan) and bot traffic (amber) over time. Hover over any bar to see exact counts for that time period.
Status Code Breakdown
See the distribution of HTTP response codes:
- 2xx (Success) — Successful requests
- 3xx (Redirect) — Redirects
- 4xx (Client Error) — Not found, forbidden, etc.
- 5xx (Server Error) — Server errors
Exporting Traffic Data
Click the "Export CSV" button to download the traffic data for further analysis in spreadsheets or other tools.
A high percentage of 4xx errors may indicate broken links or attempted attacks. Check the Paths page for specific URLs.
Bot Detection
LogLens automatically identifies and categorizes bot traffic based on user agent strings and behavior patterns.
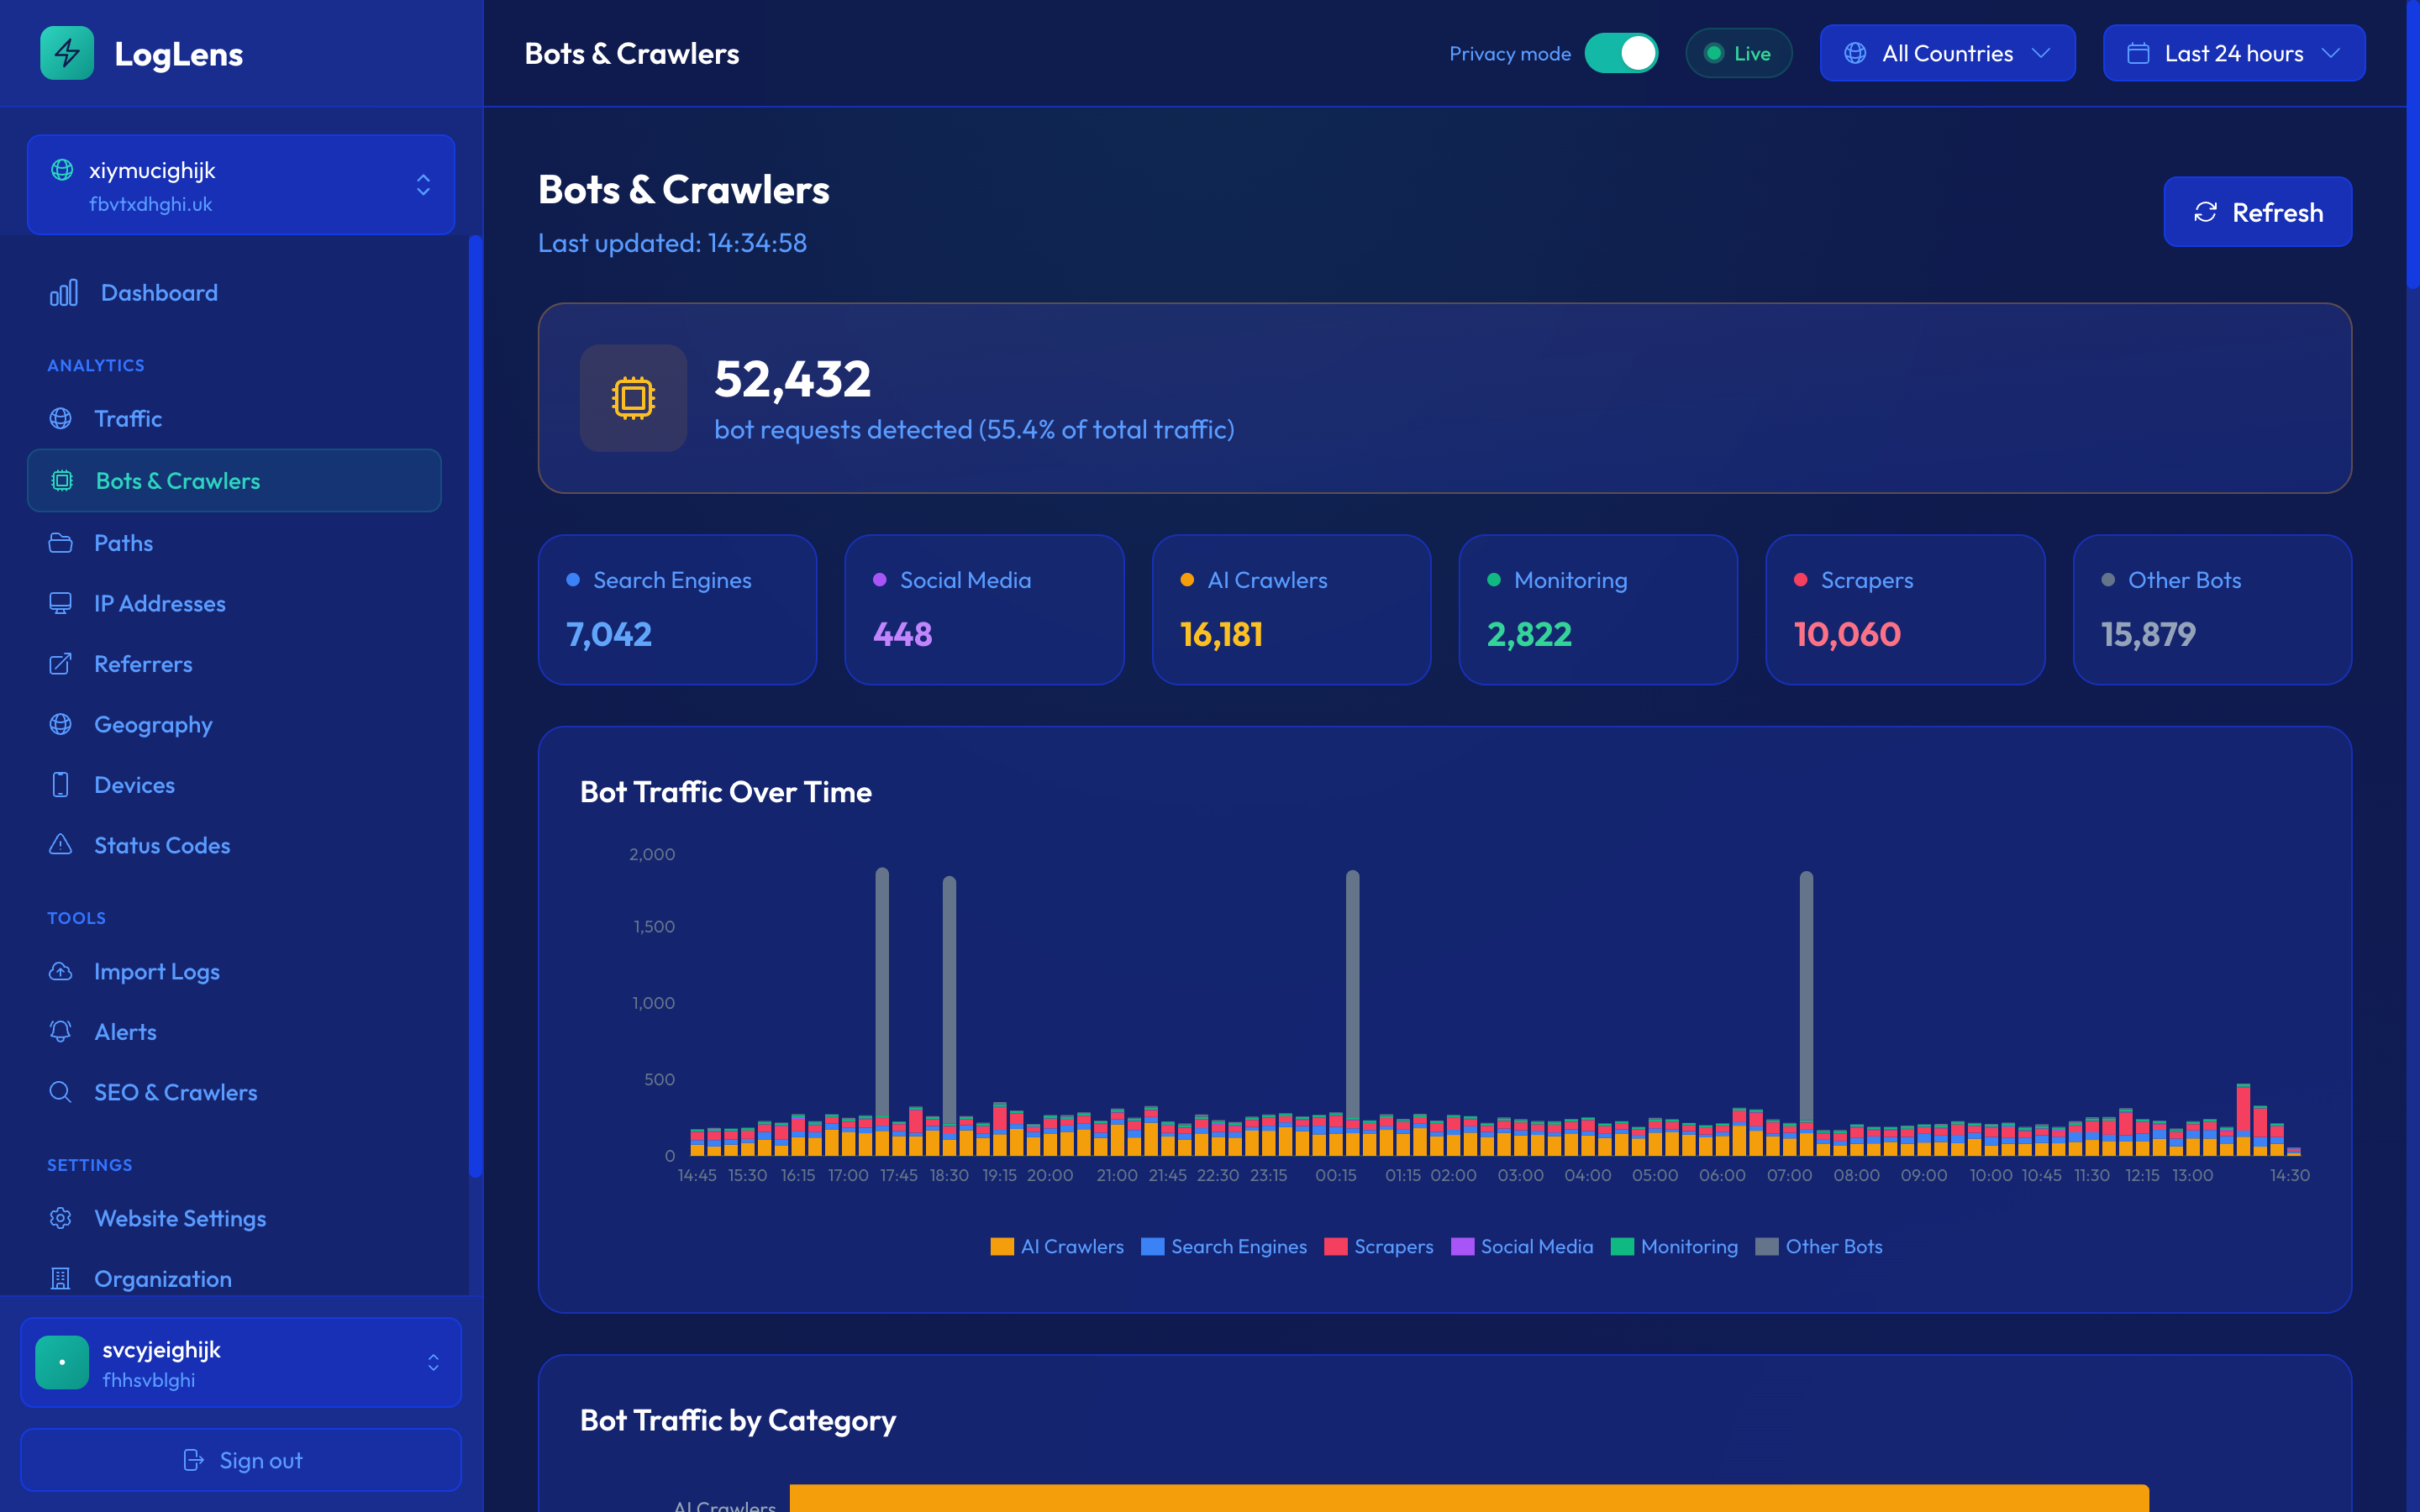
Bot Categories
| Category | Description | Examples |
|---|---|---|
| Search | Search engine crawlers | Googlebot, Bingbot, YandexBot |
| Social | Social media preview bots | Facebook, Twitter, LinkedIn |
| AI | AI training crawlers | GPTBot, ClaudeBot, Anthropic |
| Monitoring | Uptime and health checks | UptimeRobot, Pingdom |
| SEO | SEO analysis tools | Ahrefs, SEMrush, Moz |
| Feed | RSS/Atom feed readers | Feedly, NewsBlur |
| Scraper | Generic or malicious bots | Various |
Bot Detail View
Click on any bot to see detailed information including:
- Total requests and percentage of traffic
- Verification status (verified or suspicious)
- Most requested paths
- Activity over time
- Response code distribution
- Full request history with status codes and IPs
If you see a bot you want to block, note its user agent string and add it to your server's robots.txt or firewall rules.
Bot VerificationNEW
LogLens verifies that bots claiming to be from major providers (Google, Microsoft, OpenAI, etc.) are actually from their official IP ranges.
This feature helps you identify impersonator bots that claim to be Googlebot but are actually scrapers or attackers.
How Verification Works
When a request claims to be from a known bot (based on user agent), LogLens checks the client IP address against the official IP ranges published by that bot's operator:
- Google — googlebot.json (Googlebot, Google-Extended, etc.)
- OpenAI — openai.com/gptbot-ranges.json (GPTBot, ChatGPT-User)
- Microsoft — bingbot.json (Bingbot, MSNBot)
- Meta — facebookexternalhit, Facebook ranges
- Apple — Applebot
- Anthropic — ClaudeBot
- And many more...
Verification Badges
Bot requests are marked with verification badges throughout the interface:
- Verified — The IP address matches official published ranges. This is a legitimate bot.
- Suspicious — The bot claims to be from a known provider but the IP doesn't match. May be an impersonator.
Where Verification Shows
Bot verification status is displayed in:
- Live Feed on the dashboard
- Bots list page
- Bot detail pages
- Request history tables
IP Range Updates
LogLens automatically fetches the latest official IP ranges from bot operators daily to ensure accurate verification.
An unverified bot doesn't necessarily mean it's malicious—some legitimate bots don't publish their IP ranges. Use this as one signal among many when investigating suspicious activity.
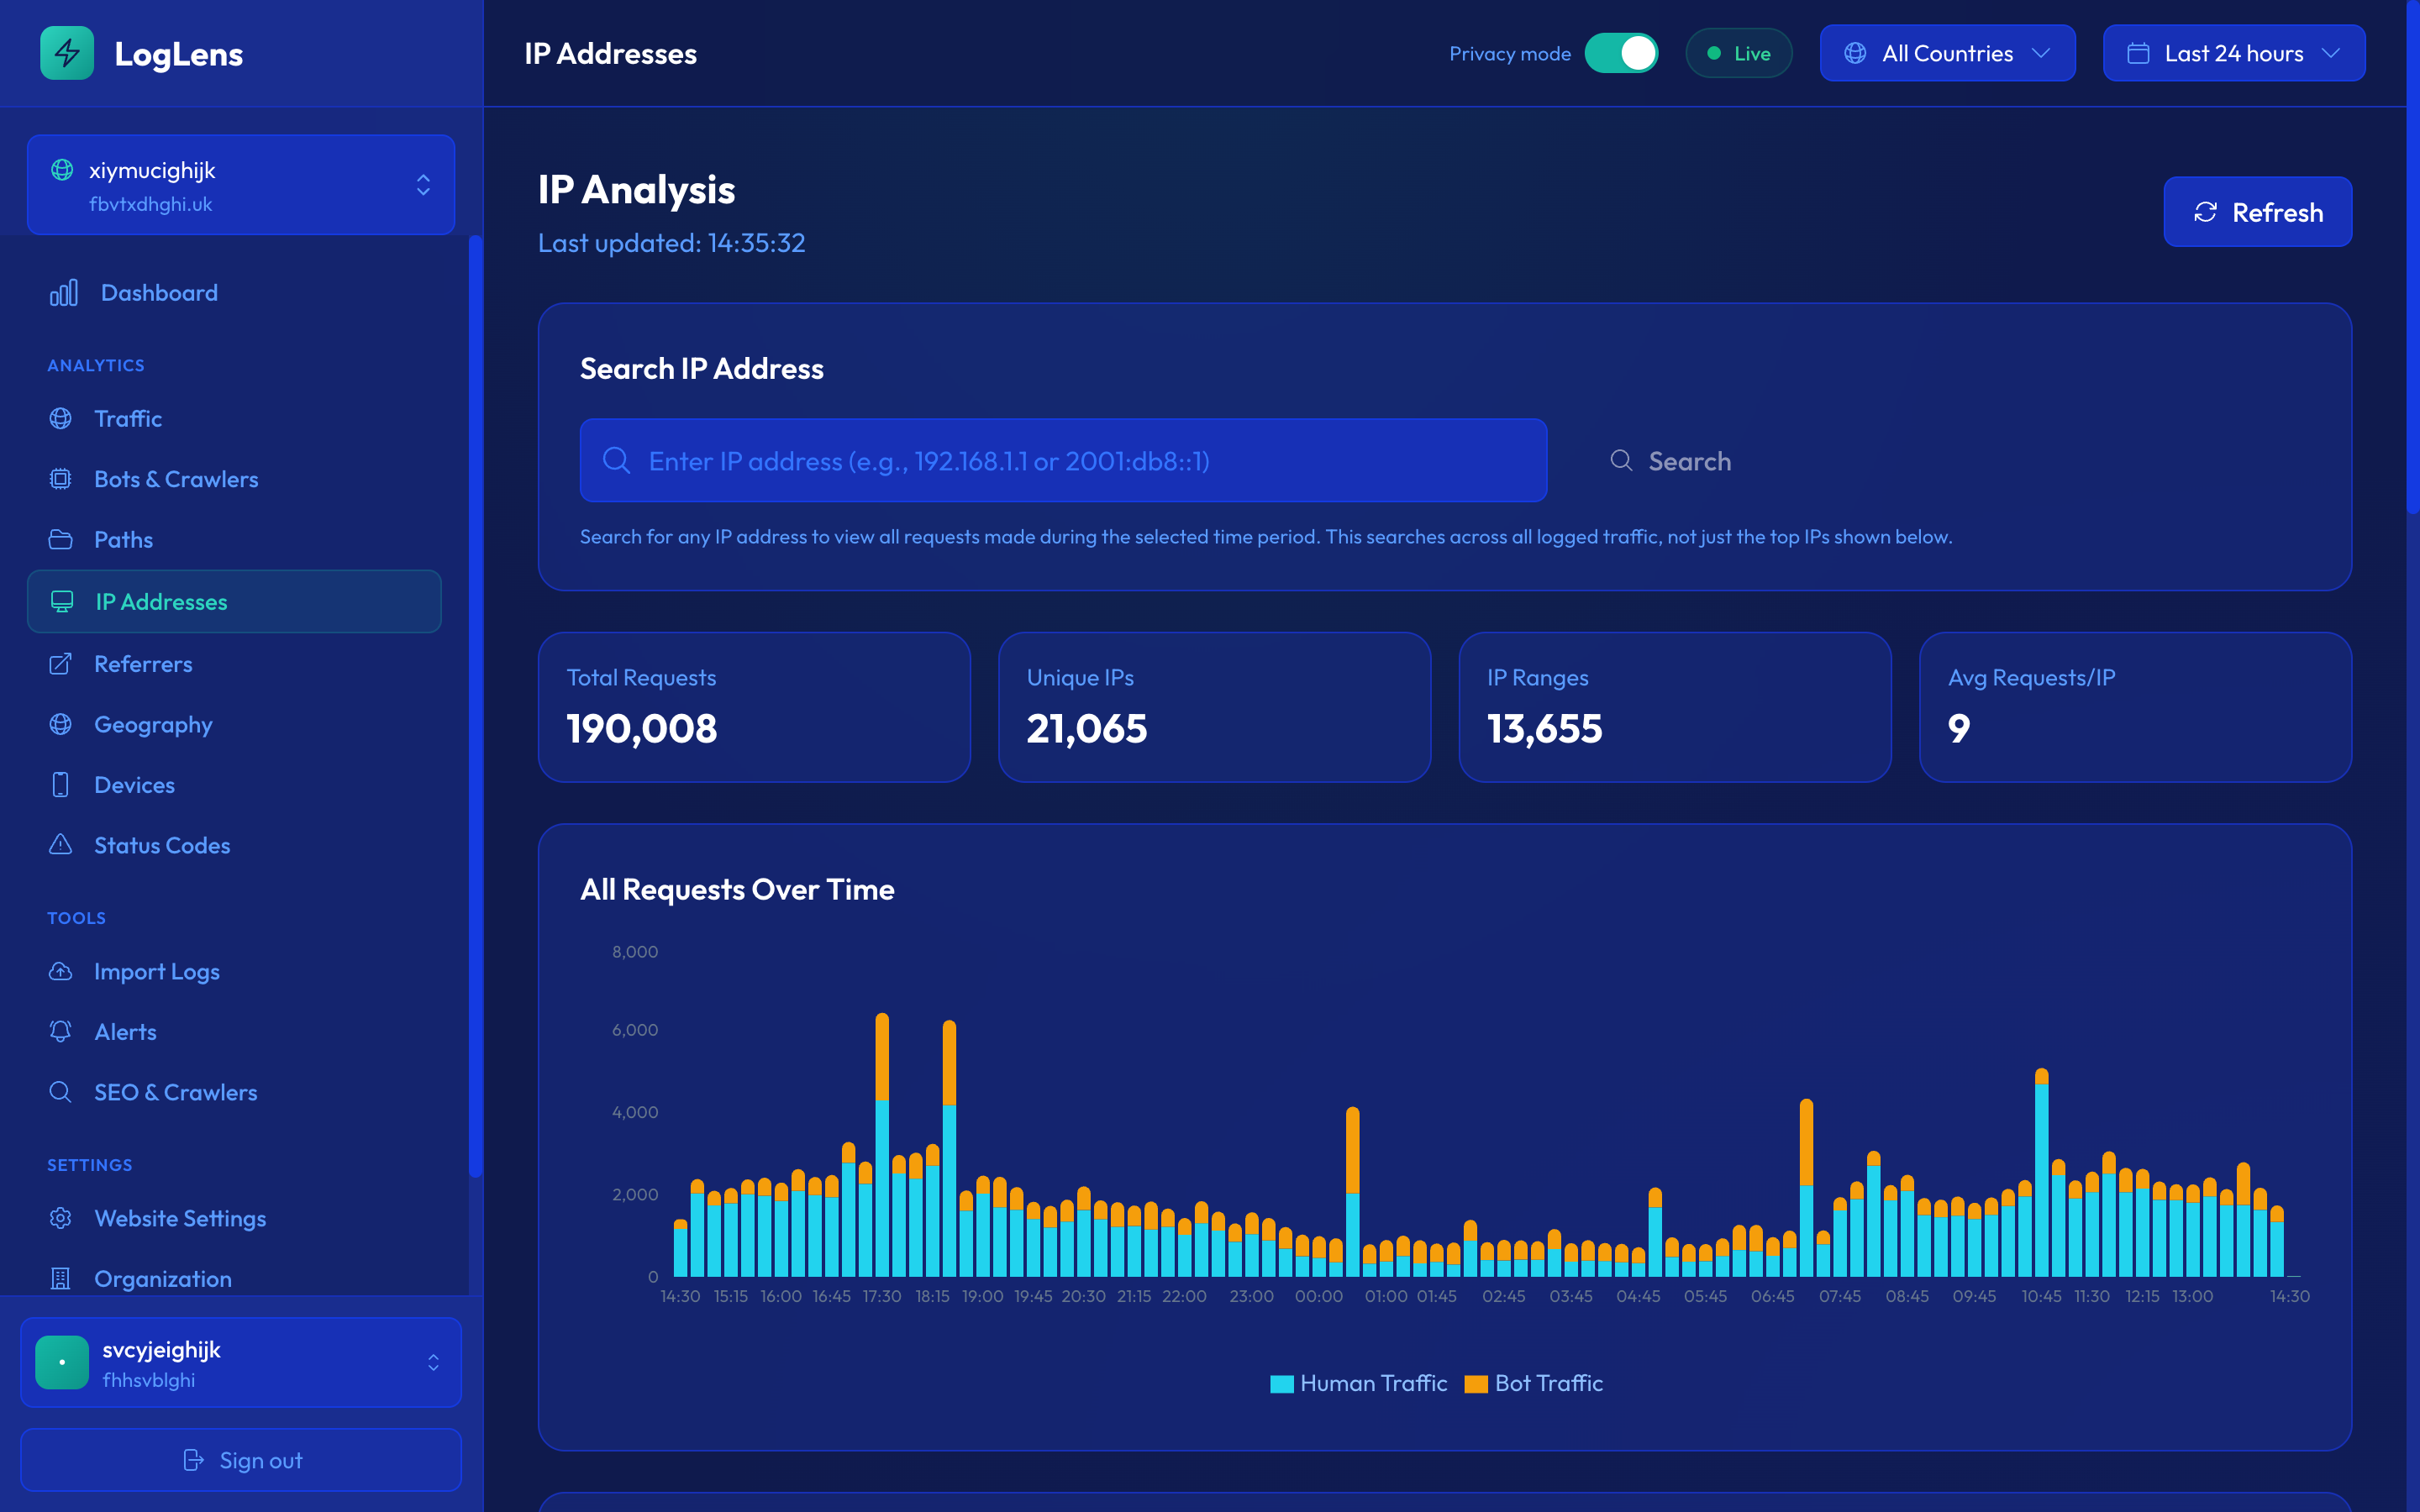
IP AddressesNEW
The IP Addresses page provides detailed analysis of traffic by individual IP addresses and IP ranges.
Identify heavy hitters, suspicious IPs, and understand traffic patterns at the network level.
IP Tabs
The page has two tabs:
- IPs — Individual IP addresses with request counts
- Ranges — IP ranges (e.g., 192.168.1.x) with aggregated request counts
Traffic Graph
A line chart shows traffic over time. When no IP is selected, it shows all traffic. Click on an IP or range to filter the graph to show only requests from that source.
Viewing Request Details
Select an IP or range and click "View Requests" to see a detailed, paginated list of all requests including:
- Timestamp
- Request path
- HTTP method and status code
- User agent
- Referrer
- Country
- Bot classification
Exporting IP Data
Use the "Export CSV" button to download the IP list or request details for further analysis.
High request counts from a single IP or narrow range may indicate bot activity, scraping, or an attack. Cross-reference with the Bots page for more context.
Path Analysis
Understand which pages and resources are most requested on your website.
Top Paths Table
Shows the most requested URLs with:
- Request count and percentage
- Average response time
- Human vs bot split
- Error rate
Path Detail View
Click any path to see detailed analytics including traffic over time, geographic distribution, and which bots are accessing it.
Filtering Paths
Use the search box to filter paths. This is useful for finding:
- Specific pages (e.g.,
/blog/) - API endpoints (e.g.,
/api/) - Static assets (e.g.,
.js,.css)
Referrers
See where your traffic is coming from.
Referrer Types
- Direct — No referrer (typed URL, bookmarks)
- Search — Google, Bing, DuckDuckGo, etc.
- Social — Facebook, Twitter, Reddit, etc.
- Other websites — Links from other sites
Referrer Detail View
Click any referrer to see which pages they're sending traffic to and how that traffic performs (bounce rate approximation based on single-request sessions).
Geography
Visualize where your visitors are located around the world.
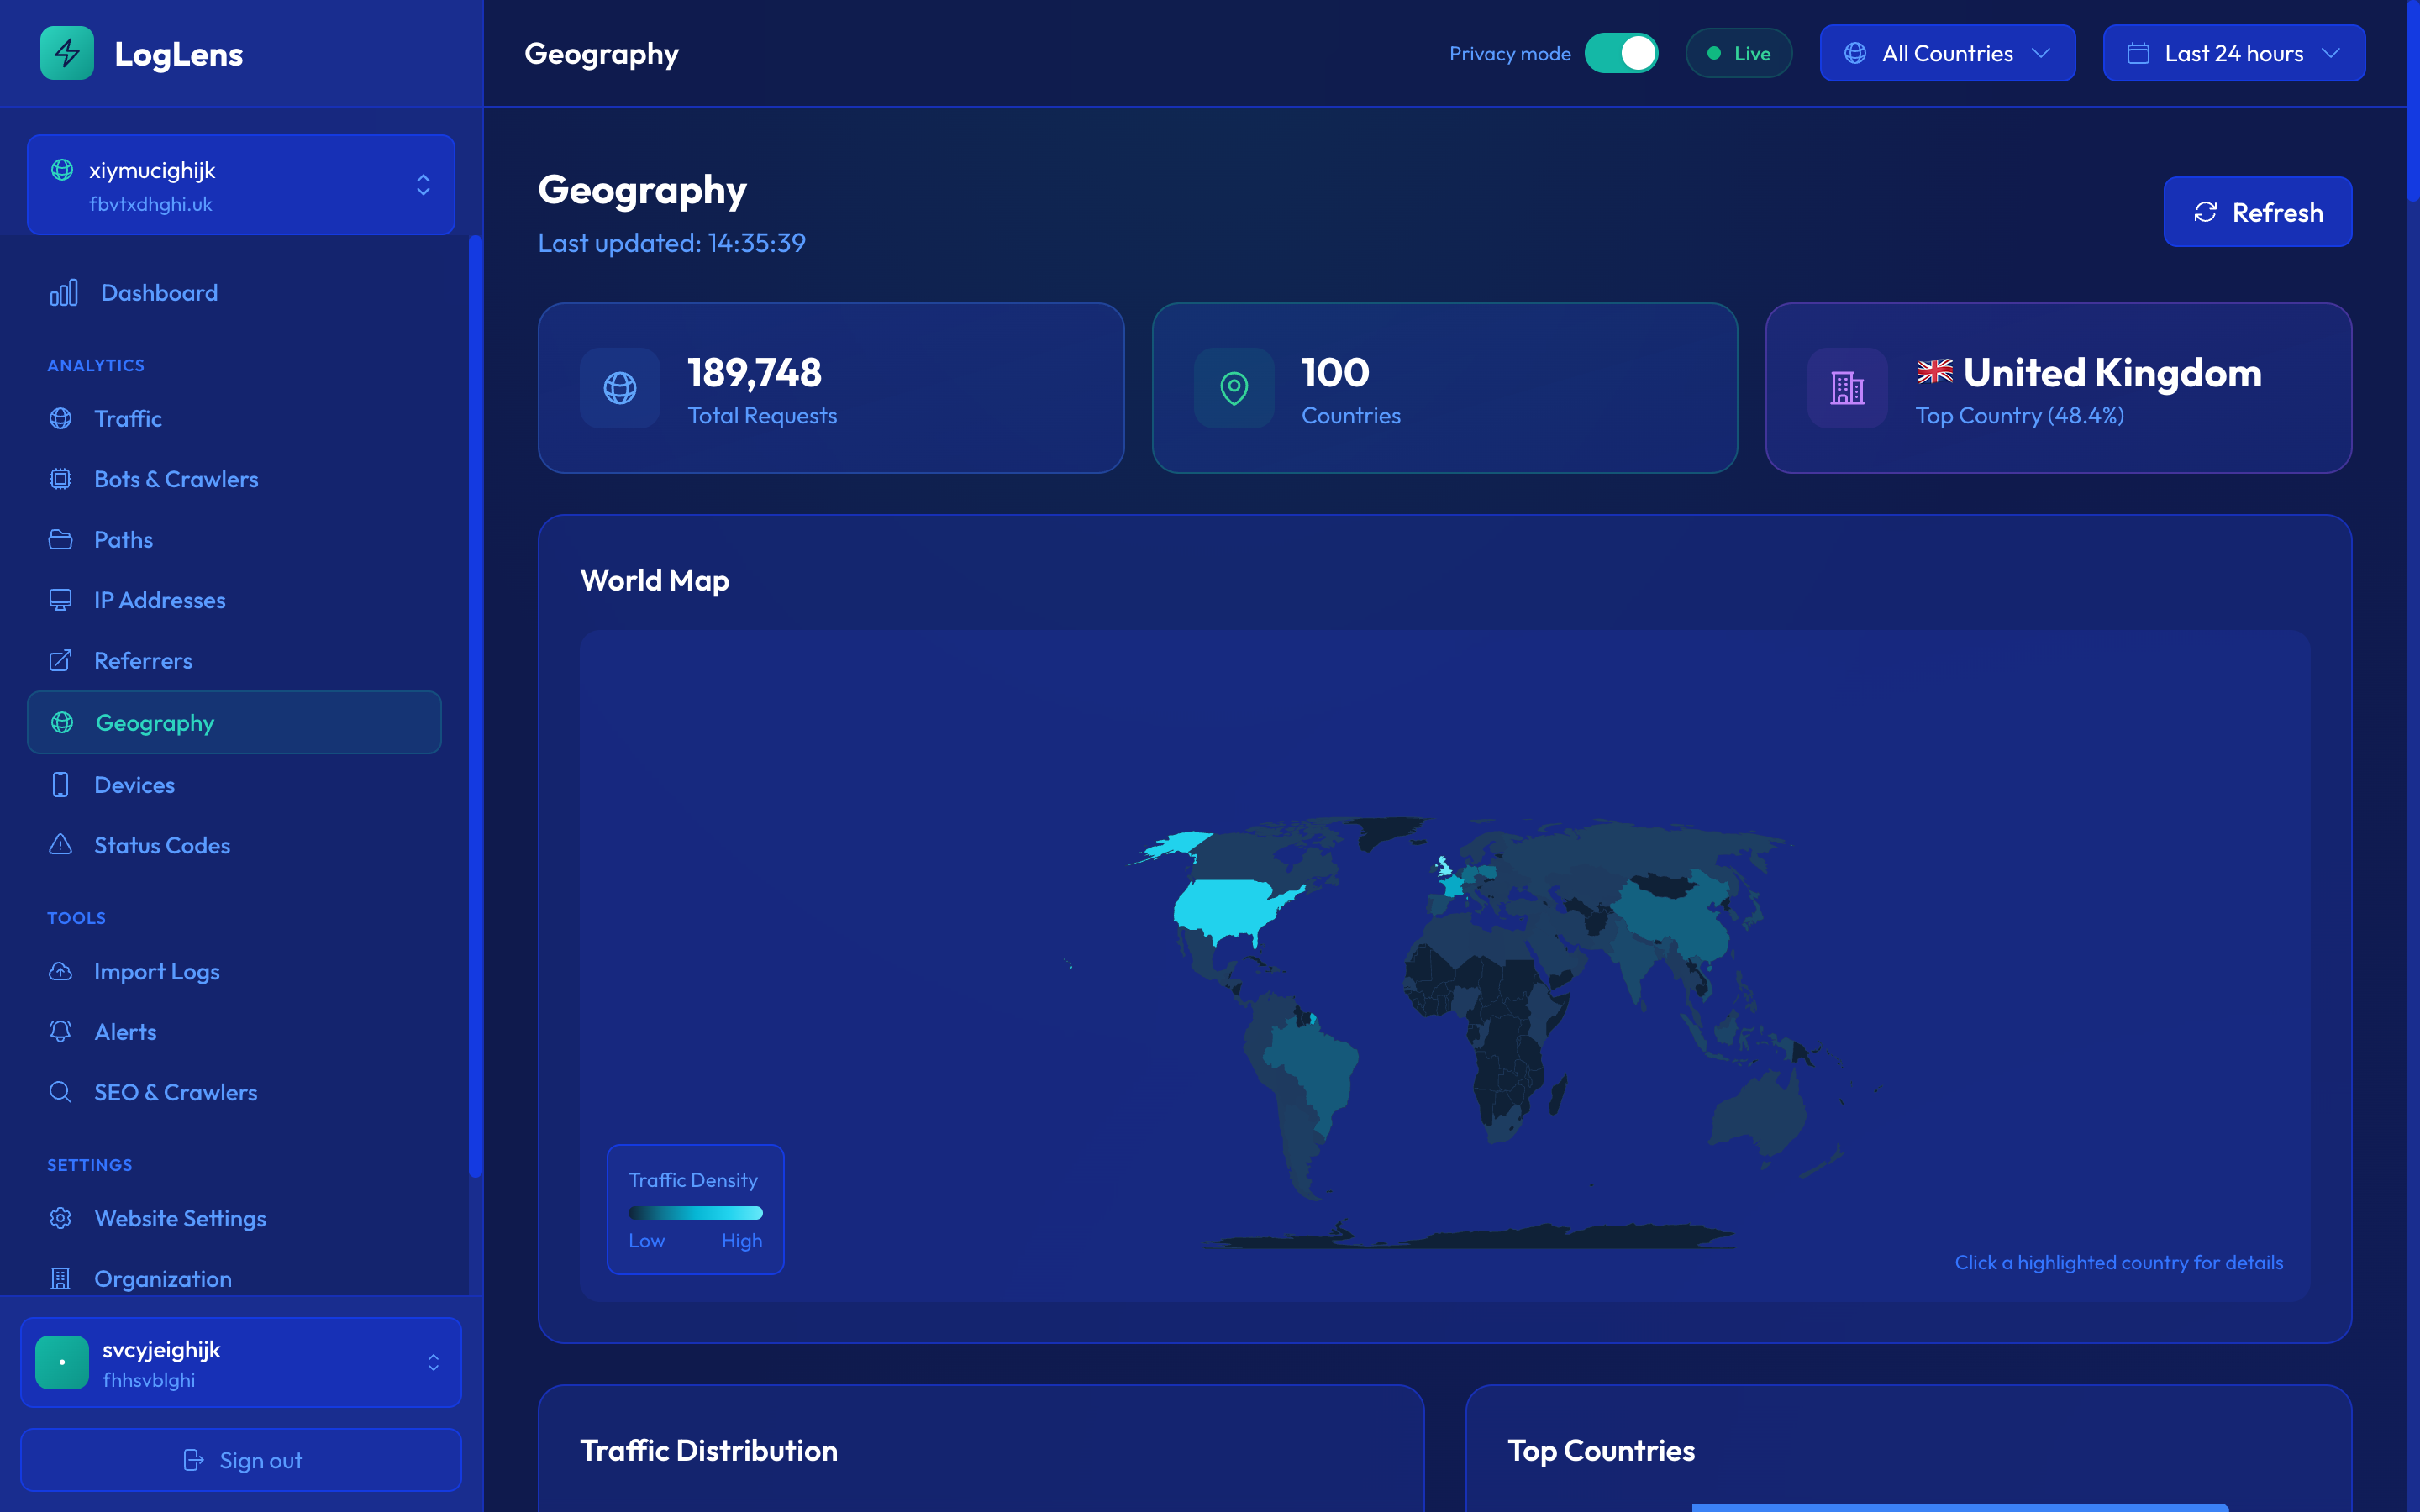
World Map
The interactive map shows traffic density by country. Darker colors indicate more traffic. Hover over any country to see exact request counts.
Country Table
A sortable table shows all countries with traffic, including:
- Request count and percentage
- Human vs bot ratio
- Top paths from that country
Unexpected traffic from certain countries might indicate bot activity or attacks. Use country filters to investigate further.
Devices
Understand what devices and browsers your visitors use.
Device Types
- Desktop — Windows, macOS, Linux
- Mobile — iOS, Android phones
- Tablet — iPads, Android tablets
- Bot — Automated crawlers
Browsers
See the distribution of browsers including Chrome, Safari, Firefox, Edge, and others.
Operating Systems
View traffic breakdown by OS: Windows, macOS, iOS, Android, Linux, etc.
Status Codes
Monitor HTTP response codes to identify errors and issues.
Status Code Categories
| Category | Meaning | Common Codes |
|---|---|---|
| 2xx | Success | 200 OK, 201 Created, 204 No Content |
| 3xx | Redirect | 301 Permanent, 302 Temporary, 304 Not Modified |
| 4xx | Client Error | 400 Bad Request, 403 Forbidden, 404 Not Found |
| 5xx | Server Error | 500 Internal Error, 502 Bad Gateway, 503 Unavailable |
Error Investigation
Click on any status code category to see which paths are returning those codes. This helps identify:
- Broken links (404s)
- Permission issues (403s)
- Server problems (5xxs)
Client ClassificationNEW
The Client Classification panel tags every request with a “client class” based on how complete its request headers are. Real browsers send a rich set of headers (Accept, Accept-Language, Accept-Encoding, sec-ch-ua, sec-fetch-*, and so on); cheap scrapers usually don’t bother spoofing them all.
Spot scrapers that hide behind a fake user agent but forget the rest of the browser fingerprint — without writing a single rule.
The classes
- Full browser — complete browser-like header set. Almost certainly a real browser, a high-effort headless setup, or a verified bot.
- Partial — some browser headers present but obvious gaps. Often headless tools, lightweight HTTP clients, or low-effort scrapers.
- Minimal — bare-bones request with just a user agent (or less). Typical of scripted scrapers, naive crawlers, and probe traffic.
Where to find it
The Client Classification panel appears on the dashboard alongside the other top-level traffic panels. Each row shows the class, request volume, and share of total traffic for the active time period.
Click-through to requests
Click any class to drill into the underlying requests. From there you can pivot to the IP, path, or user agent to investigate further. A “Minimal” row dominated by a handful of IPs claiming to be Chrome is a strong scraping signal.
Cross-reference Client Classification with Bot Verification — an unverified bot in the “Minimal” class is almost always worth blocking.
IP SearchNEW
Search for any IP address and instantly see all their requests. This is invaluable for investigating suspicious activity.
Quickly investigate any IP address by searching and viewing their complete request history.
How to Search
- Navigate to the IP Addresses page
- Enter an IP address in the search box
- Press Enter or click Search
- View all requests from that IP in the selected time period
Search Results
Results include:
- Request history — Every request with timestamp, path, status, and user agent
- Bot classification — Whether the IP was identified as a bot
- Geographic data — Country of origin
- Response times — How long each request took
Use Cases
- Investigate suspicious IPs flagged elsewhere
- Verify bot activity from a specific IP
- Track what pages a particular visitor accessed
- Debug issues reported by a user at a specific IP
Combine IP search with the Bots page to correlate suspicious bot activity with specific IP addresses.
SEO & Crawlers OverviewNEW
The SEO & Crawlers section provides comprehensive analytics for search engine optimization, including crawler statistics and sitemap coverage analysis.
Understand how search engines crawl your site and optimize your crawl budget.
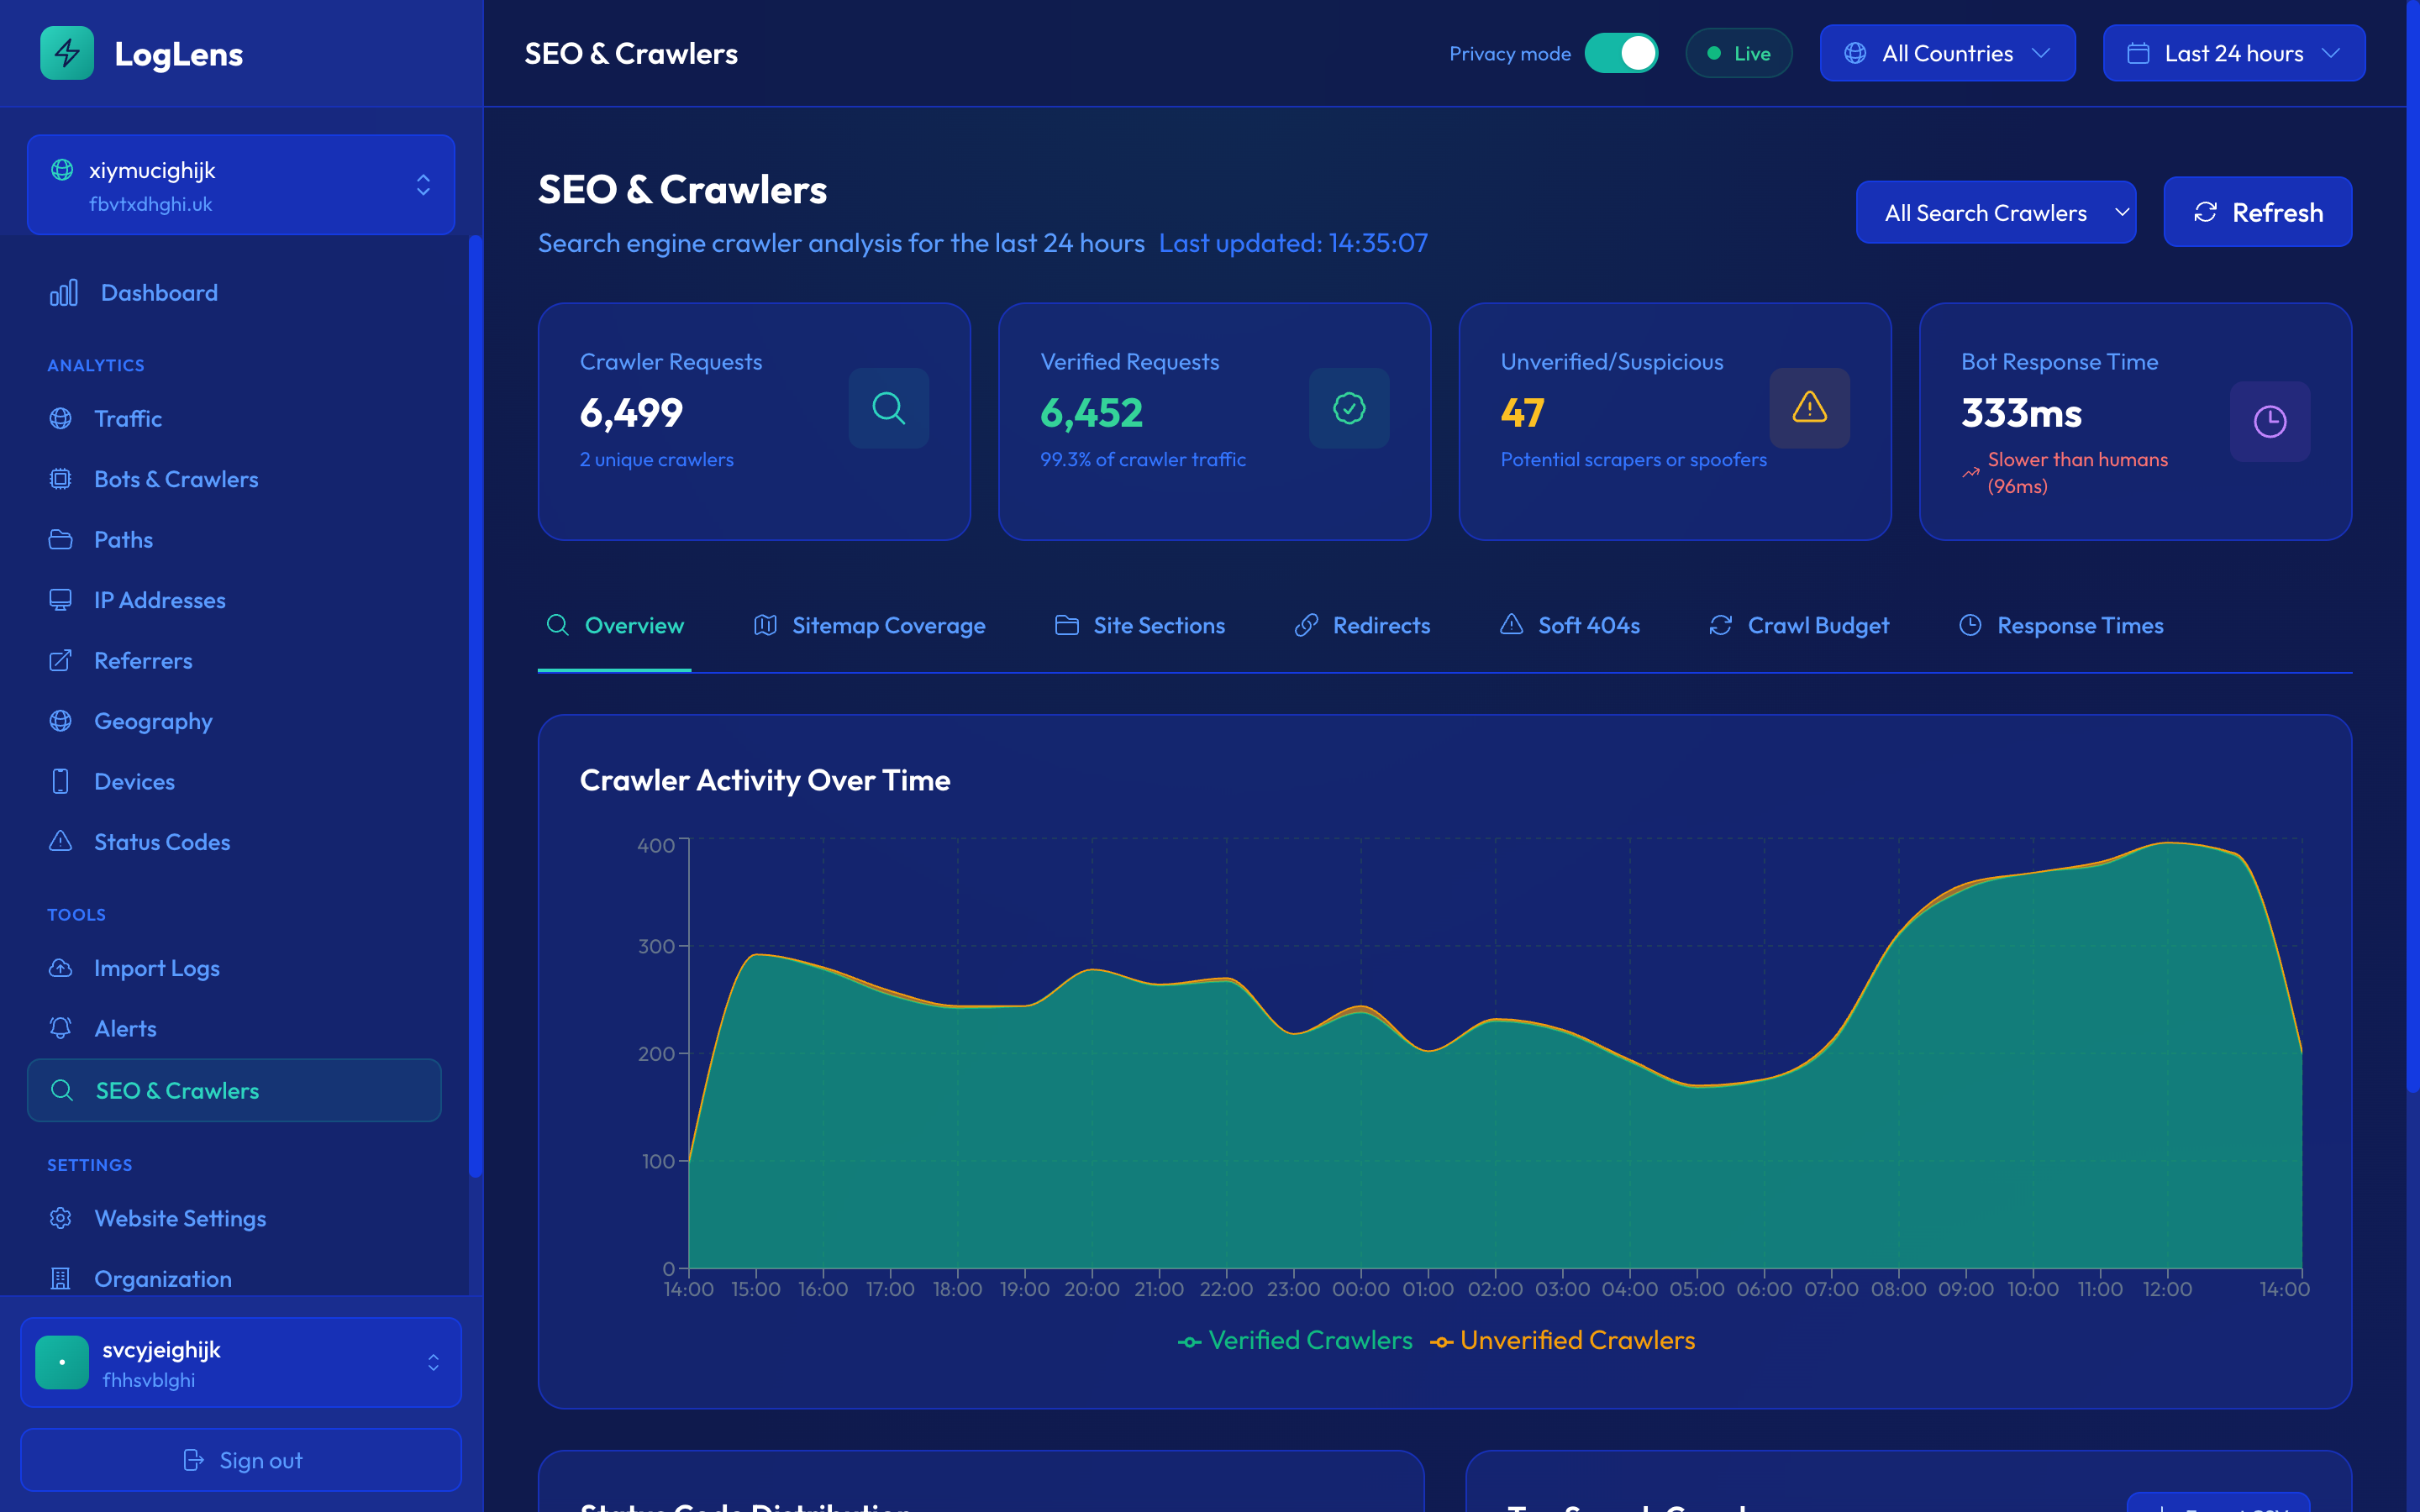
Key Metrics
| Metric | Description |
|---|---|
| Crawler Requests | Total requests from search engine bots |
| Verified Requests | Requests from verified (legitimate) crawlers |
| Unverified/Suspicious | Requests claiming to be crawlers but not verified |
| Bot Response Time | Average response time to crawler requests |
| Coverage Rate | Percentage of sitemap URLs that have been crawled |
Crawler Filter
Filter all SEO data by specific crawler using the dropdown:
- All Crawlers — Aggregate data from all search bots
- Googlebot — Google's main crawler
- Bingbot — Microsoft Bing's crawler
- Other crawlers — Yandex, Baidu, DuckDuckBot, etc.
Site Sections
View crawl activity broken down by site section (based on URL path structure). This helps identify which areas of your site receive the most crawler attention.
Sitemap CoverageNEW
Compare your sitemap URLs against actual crawler activity to identify coverage gaps and optimization opportunities.
Automatically analyzes your sitemap.xml and compares it against real crawler data.
Getting Started
- Navigate to SEO & Crawlers
- Click the "Sitemap Coverage" tab
- Click "Refresh Sitemap" to fetch and analyze your sitemap
- LogLens will automatically match sitemap URLs against crawl data
Coverage Statistics
- Total Active URLs — URLs currently in your sitemap
- Recently Crawled — URLs crawled within the last 30 days
- Stale — URLs not crawled in 30+ days
- Never Crawled — URLs in sitemap that have never been crawled
- Not in Sitemap — URLs crawled by bots but not in your sitemap
Coverage Tabs
| Tab | Shows |
|---|---|
| All Active | All URLs currently in your sitemap |
| Never Crawled | Sitemap URLs with zero crawls |
| Stale 30d+ | URLs not crawled in over 30 days |
| Recently Crawled | URLs crawled in the last 30 days |
| Not in Sitemap | Crawled URLs missing from your sitemap |
URL Details
Each URL in the table shows:
- URL Path — The page path
- First Seen — When the URL was first added to sitemap
- Times Crawled — Total number of crawl requests
- Last Crawled — When it was last crawled
- Last Bot — Which crawler last visited
- Status — Crawled, Not Crawled, or Stale
Sorting
Click any column header to sort the table. This works across the entire dataset, not just the current page.
Filter by a specific crawler (e.g., Googlebot) to see coverage from Google's perspective only.
Crawl HistoryNEW
View detailed crawl history for any URL by clicking on a row in the Sitemap Coverage table.
History Modal
Click any URL to open a modal showing:
- Total crawls — How many times the URL has been crawled
- Bot summary — Breakdown by crawler (Googlebot, Bingbot, etc.)
- Request history — Individual crawl events with timestamps
Request Details
Each crawl event shows:
- Timestamp
- Bot name
- HTTP status code
- Response time
- Country (crawler location)
Pagination & Export
- Use the "Rows" dropdown to change how many events to show (25-500)
- Navigate through pages with Previous/Next buttons
- Click "Export CSV" to download the crawl history
Crawl history shows the last 30 days of events. For URLs with very high crawl volumes, older events may not be available.
Google IndexNEW
The Google Index tab correlates your server log data with Google Search Console data to show which of your pages are crawled, indexed, and performing in search results.
See which of your pages Google has crawled and indexed, all in one view.
You must connect Google Search Console first. See Google Search Console integration for setup instructions.
Four Buckets
Every URL is classified into one of four buckets based on crawl and index status:
| Bucket | Color | Description |
|---|---|---|
| Crawled + Indexed | Green | Working as expected — Google has crawled and indexed the page |
| Crawled + Not Indexed | Amber | Google crawled the page but chose not to index it |
| Not Crawled + Indexed | Rose | Indexed from cache or links but not recently crawled by Googlebot |
| Not Crawled + Not Indexed | Gray | Neither crawled nor indexed — may need attention |
| Pending Inspection | Gray | Awaiting URL Inspection API results |
Directory Breakdown
See per-directory bucket counts to understand which sections of your site are well-indexed and which need attention. Click on any directory to filter the URL list below.
URL Drill-Down
Click on any bucket to see the individual URLs in that category. The URL table shows:
- URL Path — The page path
- Crawls — Number of Googlebot crawls in the last 90 days
- Last Crawled — When Googlebot last visited
- Index Status — Indexed or not indexed (with reason)
- Impressions (28d) — Search impressions in the last 28 days
- Clicks (28d) — Search clicks in the last 28 days
Results are paginated for sites with large numbers of URLs.
"Crawled" means Googlebot visited in the last 90 days based on your server logs. "Indexed" status comes from the GSC URL Inspection API.
Data Freshness
- Search analytics — 2-3 days behind real-time (Google's processing delay)
- URL inspection — Cached for 7 days, then re-inspected
- Crawl data — Based on the last 90 days of server logs
LLM CrawlersNEW
The LLM Crawlers page provides a dedicated view for monitoring AI and large language model bot activity on your website.
Understand exactly how AI crawlers are accessing your content, which pages they read most, and whether they are legitimate.
Bot Categories Tracked
LogLens identifies and tracks all major LLM crawlers, including:
| Crawler | Operator |
|---|---|
| GPTBot | OpenAI |
| ChatGPT-User | OpenAI |
| ClaudeBot | Anthropic |
| Google-Extended | |
| CCBot | Common Crawl |
| Bytespider | ByteDance |
| PerplexityBot | Perplexity |
| Meta-ExternalAgent | Meta |
Key Metrics
The LLM Crawlers page displays several key metrics at a glance:
- Total Requests — The total number of requests from LLM crawlers in the selected time period
- Unique Pages Accessed — How many distinct pages AI crawlers have visited
- Response Times — Average response time served to LLM crawlers
- Verification Status — How many requests come from verified vs unverified LLM bots
Bot Verification
LogLens checks each LLM crawler's IP address against official IP ranges published by the bot operator. This tells you whether a crawler claiming to be GPTBot or ClaudeBot is genuinely from OpenAI or Anthropic, or if it is an impersonator.
- Verified — IP matches the operator's published ranges
- Unverified — Claims to be a known LLM crawler but IP does not match
Page Access Patterns
See which pages AI crawlers are reading most frequently. This helps you understand what content LLM providers are training on or using for retrieval, and whether they are respecting your robots.txt directives.
Time-Series Trends
View LLM crawler activity over time to spot trends, sudden increases in AI crawling, or changes in behaviour after updating your robots.txt.
Filtering by Crawler
Use the crawler dropdown to filter all data to a specific LLM bot. This lets you compare activity across different AI providers and understand each crawler's behaviour individually.
If you want to block specific LLM crawlers, add their user agent to your robots.txt. For example, User-agent: GPTBot followed by Disallow: / will block GPTBot from crawling your site.
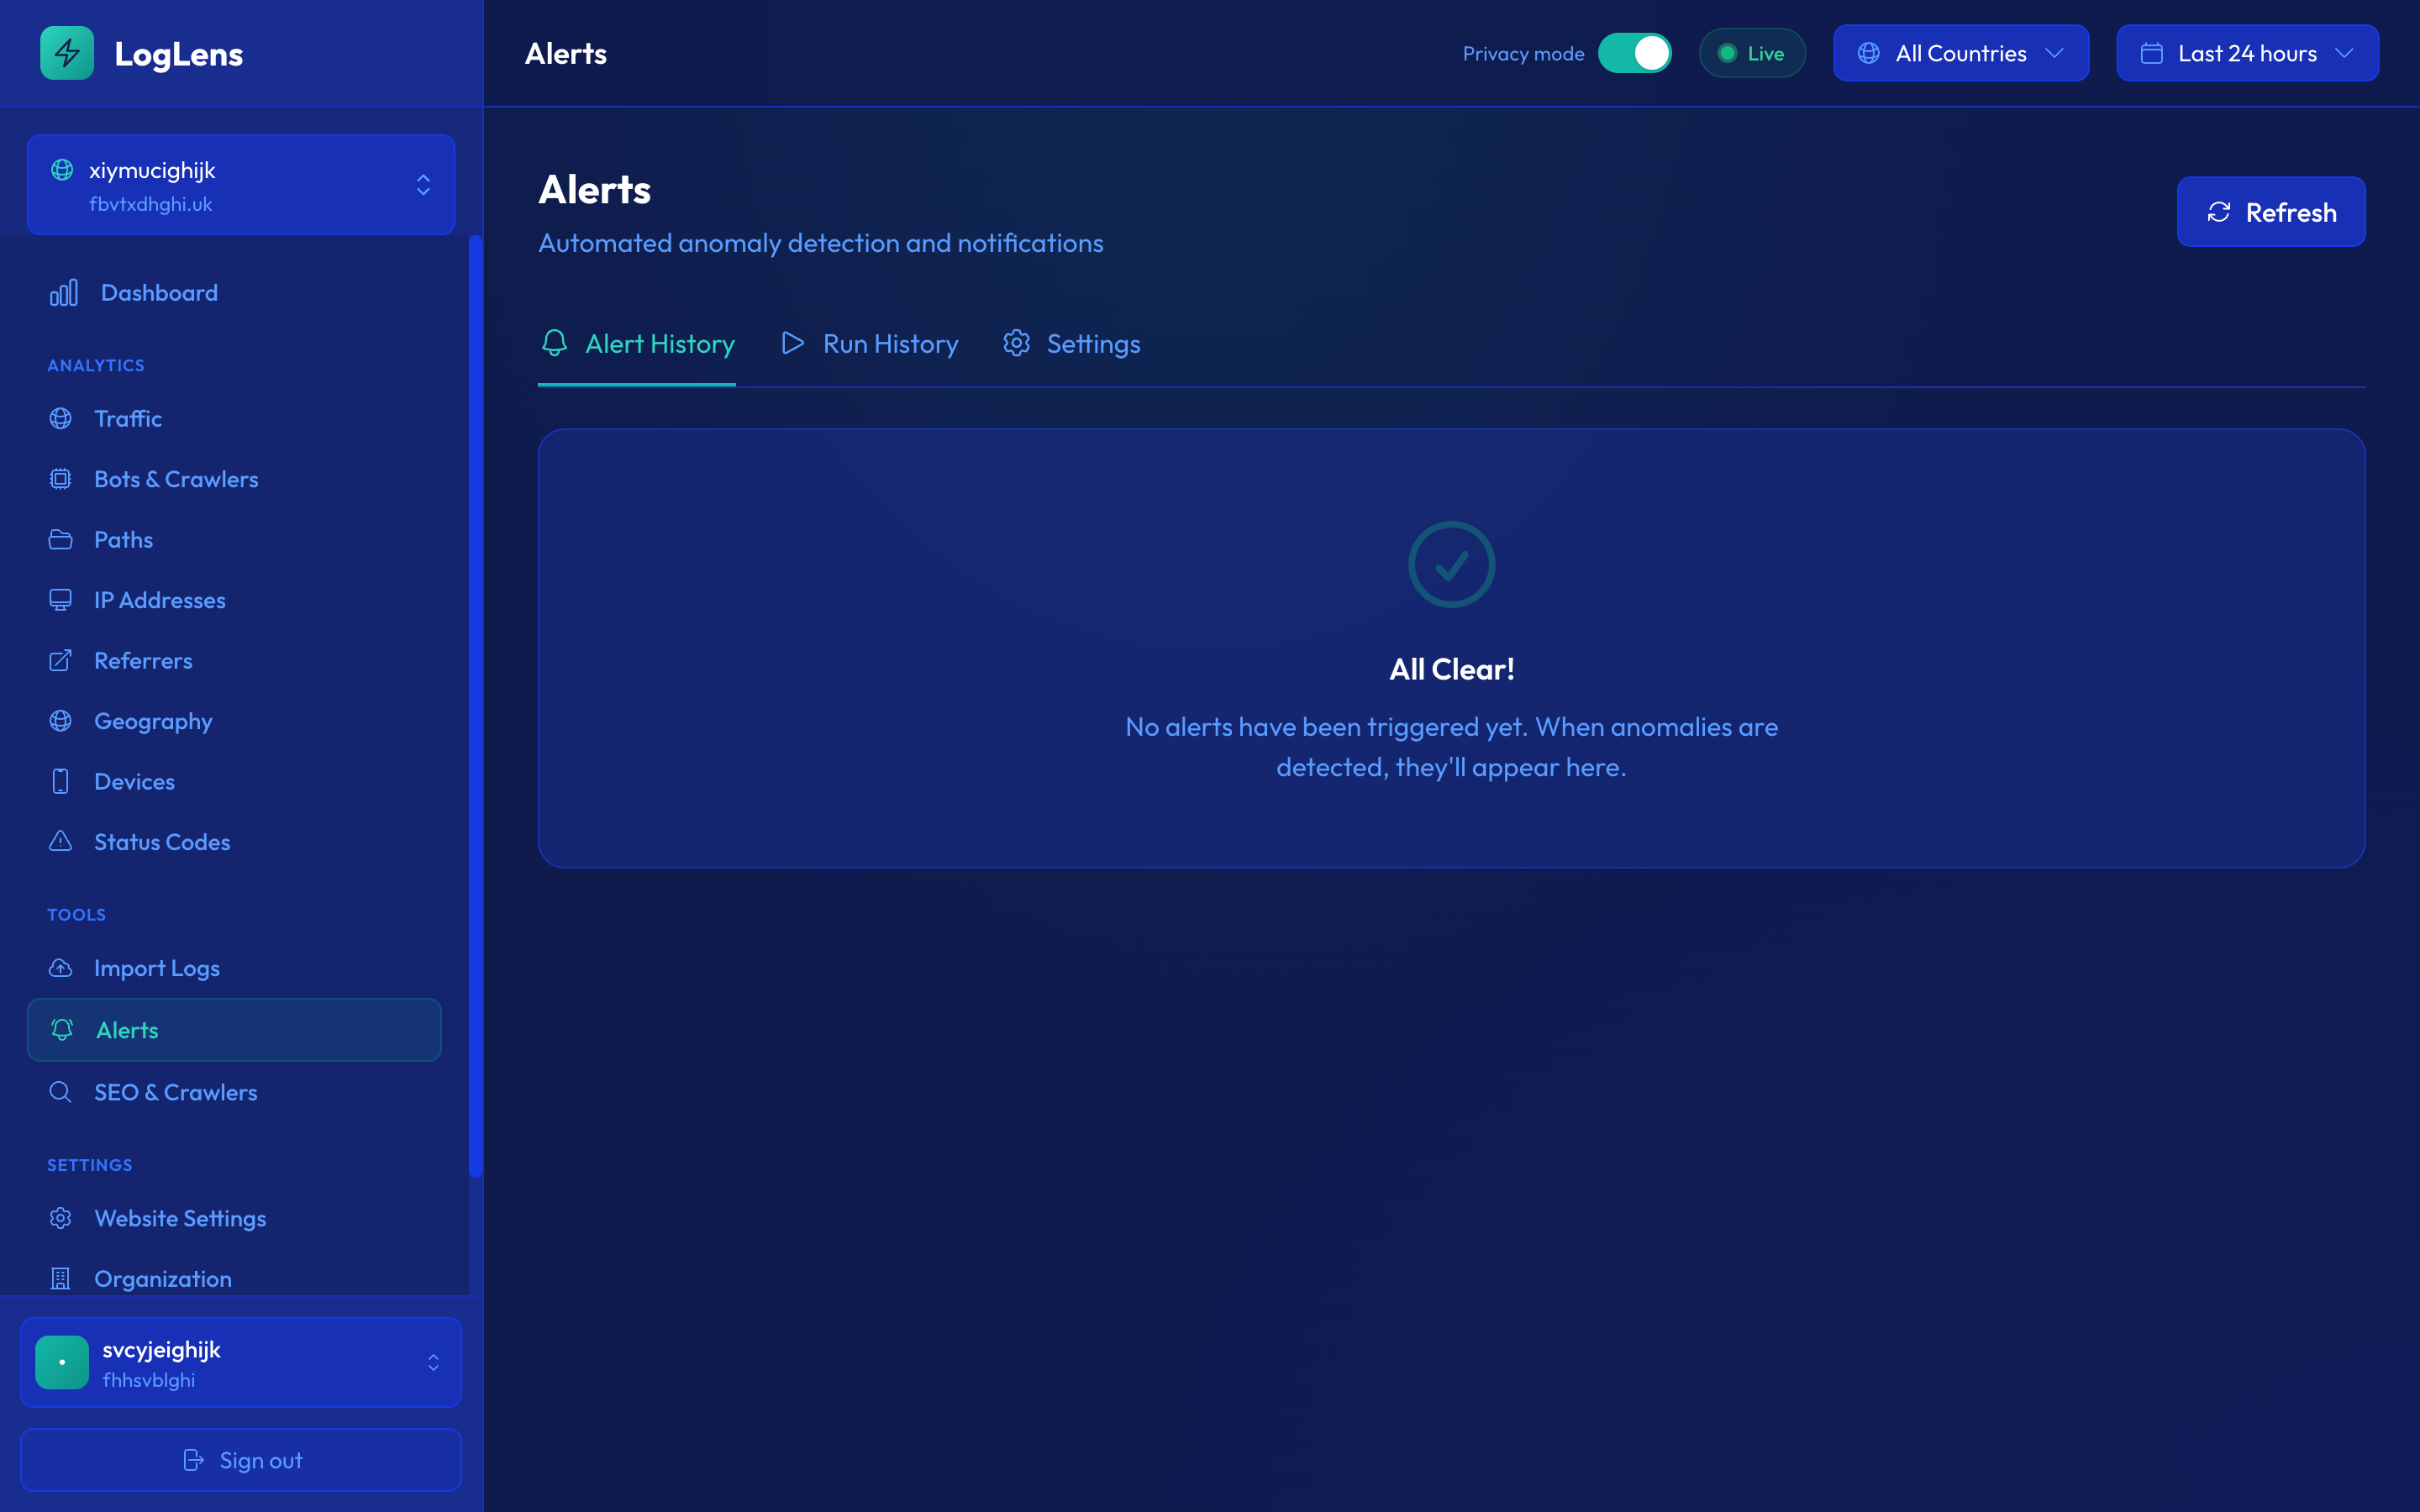
AlertsNEW
LogLens monitors your traffic and automatically alerts you when anomalies are detected.
Get instant email notifications when traffic spikes, errors surge, or bots behave unusually.
How Alerting Works
- Baseline Building — LogLens monitors your traffic for 24 hours to establish a normal baseline
- Anomaly Detection — Incoming metrics are compared against the baseline using statistical analysis
- Alert Triggering — When metrics deviate significantly from the baseline, an alert is triggered
- Email Notification — You receive an email with details about the anomaly
- Cooldown — To prevent alert fatigue, there's a cooldown period before the same alert can trigger again
Baseline Status
The Alerts page shows your baseline building progress. You need 24 hours of data before anomaly detection becomes active.
Alert Types
LogLens ships with sixteen alert types, grouped into four categories. Each is enabled by default; you can disable any of them or change their check frequency in Alert Settings.
Critical (red — page someone now)
| Alert | What it detects |
|---|---|
| Server Error Spike 5xx | Unusual rate of 5xx server errors. Visitors are seeing failures — check your origin, recent deployments, and downstream services. |
| Traffic Blackout | Traffic has dropped to near-zero compared to your baseline. LogLens probes the site over HTTP before firing to confirm it’s actually unreachable rather than just quiet. |
| Crawler Error Spike | Search engine crawlers (Googlebot, Bingbot etc.) are receiving an elevated error rate. Pages that crawlers can’t fetch will eventually drop out of the index. |
| Exposed Secret in URL | A scan of your URLs detected a token, API key, JWT, AWS access key, Stripe live key, or other sensitive value. Once a value lands in URLs it ends up in CDN logs, browser history, and referer headers — treat it as compromised and rotate immediately. |
| Automated Hacking Probe NEW | Scanner activity targeting known-vulnerable paths (/.env, /wp-config.php, /.git/config, etc.), known scanner user-agents (sqlmap, nuclei, nikto), or attack patterns in URLs (SQL injection, path traversal, XSS, Log4Shell). Promotes to critical when any probe gets a 200/30x response — meaning the targeted resource may exist on your site. |
High (orange — investigate soon)
| Alert | What it detects |
|---|---|
| Crawler Disappearance | A search engine crawler that normally visits your site has stopped or sharply reduced its visits. Often the leading indicator of an indexing problem. |
| Massive Traffic Spike | Traffic far above normal levels. Could be viral content, a press hit, or aggressive scraping/DDoS — the top-hit URLs in the email tell you which. |
| Bot Impersonation Surge | A spike in bots claiming to be Googlebot/Bingbot/etc. but coming from IPs that don’t belong to those crawlers. Scrapers often forge UAs to bypass robots.txt. |
| Latency Degradation | Average response time has risen significantly. The slowest URLs in the email tell you where to look first. |
Medium (yellow — keep an eye on)
| Alert | What it detects |
|---|---|
| 404 Spike | An unusually high number of not-found errors. Often means a deploy changed URLs, an external link points somewhere that no longer exists, or an attacker is path-fuzzing. |
| Human Traffic Drop | Real-user traffic has dropped while bot traffic remains stable — suggests a routing issue, SEO penalty, broken redirect, or UX problem affecting only humans. |
| Redirect Storm | An unusually high proportion of 3xx responses. Most often a misconfigured redirect rule looping or a scraper hammering an apex domain that redirects. |
| Client Error Spike 4xx | Elevated rate of 4xx client errors (excluding the dedicated 404 spike). Usually points to authentication issues, broken APIs, or malformed clients. |
Informational (blue — context only)
| Alert | What it detects |
|---|---|
| Bot Ratio Shift | The proportion of bot vs. human traffic has changed significantly — new crawler, new scraper, or a change in your CDN/WAF config. |
| Traffic Pattern Anomaly | Traffic is unusual for this time of day but doesn’t match a more specific pattern. Worth a glance. |
| Crawler Frequency Change | A search engine crawler’s rate has changed significantly — not a disappearance, just a meaningful up/down. |
Every alert email includes AI severity scoring and a one-paragraph narrative explaining what’s happening, plus a deep link into the relevant dashboard view with the time window pinned to when the alert fired.
Alert Settings
Configure each alert type independently in the Settings tab of the Alerts page.
Per-Alert Configuration
Each alert type can be configured with:
- Enabled/Disabled — Toggle the alert on or off
- Check Frequency — How often to check for anomalies (1 min to 24 hours, based on your plan)
Check Frequency Options
| Frequency | Best For |
|---|---|
| 1 minute | Critical production systems (Enterprise) |
| 5 minutes | High-traffic sites needing quick detection |
| 15 minutes | Most production sites |
| 1 hour | Standard monitoring |
| 24 hours | Daily summary (Free tier) |
You might want different frequencies for different alert types—for example, check errors every 5 minutes but bot activity every hour.
Alert History
The Alerts page has two history views:
Alerts Tab
Shows all triggered alerts with:
- Alert type (Traffic, Error, Bot)
- Severity level
- Description of the anomaly
- Timestamp
- Metrics (expected vs actual values)
Run History Tab
Shows every time the alert system ran, even when no alert was triggered. This helps you verify that monitoring is working correctly:
- Run timestamp
- Alert type checked
- Status (no anomaly detected, or alert triggered)
- Metrics at the time of check
Use Run History to verify your alerts are running at the expected frequency. If you don't see recent runs, check your alert settings.
AI Alert TriageNEW
Every alert email is enriched by an AI triage pass before it reaches your inbox. We send the alert details to Claude (Anthropic’s LLM) and ask it three things:
- Severity score — a 1–5 rating combining the rule-based severity with judgement about the specifics. A 4xx spike caused by one bad scraper hitting one path is a 2; the same spike caused by a deployment breaking your homepage is a 5.
- Narrative — one or two sentences explaining what looks to be happening, written for someone who didn’t see the metrics.
- Recommended next step — the most useful single thing to do right now (e.g. “block the source IP at your WAF”, “check the latest deploy for routing changes”).
The triage block appears at the top of every alert email above the raw stats, so you can decide in five seconds whether to dig in or close the tab. If the triage call fails (cold start, rate limit, etc.) the email still sends with all its rule-based content — you never lose alerts.
The triage runs on Claude Haiku (Anthropic’s fastest model) with a 15-second timeout. Cost is roughly $0.004 per alert, included in your plan.
Alert SuppressionNEW
Some alerts are technically true but operationally noise — an enthusiastic scraper hitting the same 404 over and over, a known-bad bot you’ve already decided to live with. Every alert email about crawler errors includes one-click suppression buttons:

What gets suppressed
- Per-crawler suppression — “Don’t alert for BotXYZ” stops crawler-related alerts about that specific bot.
- Per-status-code-and-crawler suppression — “Don’t alert on 404 errors for BotXYZ” is more surgical: that bot can still trigger alerts about 5xx errors, but its 404s are filtered out.
Click a suppression link from any alert email; the rule is added to your alert config instantly. You can review and remove suppressions on the Alerts › Settings page.
Weekly Email ReportsNEW
Every Monday morning at 8:00 UTC, every site you own gets a digest email summarising the week. The report covers:
- Headline numbers — total requests, unique visitors, bot share, crawler share, week-over-week change.
- Top movers — pages that gained or lost the most traffic vs. last week.
- SEO health — crawler activity by bot, indexed-page count from Google Search Console (if connected), and any sitemap-coverage changes.
- Alerts fired — a count of alerts that fired during the week, grouped by type.
Reports are sent to all admins of the website’s organisation. To opt out for an organisation, head to Organisation Settings › Notifications.
Daily DigestNEW
The daily digest is a once-a-day email summarising the previous 24 hours for each of your sites — traffic totals, bot share, top movers, anything that fired an alert, and any unverified-bot or scraping activity worth knowing about.
Daily digests are now included on every plan, including Free and Basic. (Previously paid-only.)
What’s in it
- Yesterday at a glance — total requests, human vs. bot split, change vs. the previous day.
- Notable changes — pages, bots, or countries that moved sharply.
- Alerts fired — a roll-up of any alerts that triggered in the last 24 hours.
- Recommendations preview — a peek at the top items currently sitting on your Recommendations page.
Opting in or out
Daily digests are on by default. To opt out (or opt back in), head to Organisation Settings › Notifications and toggle “Daily digest”. Settings are per-user, so each member of your org chooses for themselves.
CSV ExportNEW
Export data from any table in LogLens to CSV for further analysis in spreadsheets or other tools.
Export visible rows quickly, or queue an “Export all” job that drops the full dataset into Downloads when it’s ready.
How to Export
- Navigate to any page with data tables (Bots, Paths, IPs, Recommendations, etc.)
- Click the “Export CSV” (or per-tab “Export this page”) button above the table
- If there’s more data than displayed, choose between:
- Export this page — Instant download of the currently displayed rows
- Export all data — Queues a background job that fetches the full dataset and writes the CSV to your Downloads page when ready (best for large or paginated datasets)
- Per-page exports start downloading immediately; “Export all” jobs notify you when finished
Filenames
Exported filenames include the site domain, the table name, and the time range — e.g. example.com-recommendations-ips-7d.csv — so you can keep multi-site exports straight without renaming.
Sortable columns
Most tables have sortable columns with a 3-state cycle: click a header to sort descending, click again for ascending, click a third time to clear and return to the default order. The current sort is reflected in the export, so you can shape the CSV before downloading.
Country flags
Tables that include a country column show the flag inline next to the ISO code. Hover any flag for a tooltip with the full country name. Flags are decorative in the CSV — the underlying ISO code and country name are written as plain text.
Export Locations
Export buttons are available on:
- Traffic page (hourly breakdown)
- Bots page (all bots list)
- Bot Detail page (paths and request history)
- Paths page
- Referrers page
- Geography page
- Devices page (browsers and OS)
- IP Addresses page (IPs, ranges, and request details)
- Status Codes page
- Alerts page (alert history and run history)
- Recommendations page — per-tab “Export this page” for IPs to block, 404s to fix, Unverified bots, and Slow paths, plus an “Export all data” option that queues each tab’s full dataset to Downloads
Very large exports (>100,000 rows) may take several minutes. Use “Export all data” — it runs in the background and the file lands in your Downloads page so you don’t need to keep the tab open.
Public APINEW
Access your LogLens analytics data programmatically through our REST API.
Build custom dashboards, integrate with your tools, or automate reporting.
Getting an API Key
- Go to Organization Settings
- Navigate to the "API Keys" section
- Click "Create API Key"
- Give your key a name and copy it (it's only shown once!)
Available Endpoints
| Endpoint | Description |
|---|---|
GET /websites |
List all websites in your organization |
GET /websites/{id}/summary |
Traffic summary statistics |
GET /websites/{id}/traffic |
Traffic over time data |
GET /websites/{id}/bots |
Bot analytics |
GET /websites/{id}/paths |
Path/page analytics |
GET /websites/{id}/geography |
Geographic distribution |
GET /websites/{id}/status-codes |
HTTP status code breakdown |
GET /websites/{id}/ips |
IP address analytics |
GET /websites/{id}/referrers |
Referrer domain analytics |
GET /websites/{id}/devices |
Device, browser, OS breakdown |
GET /websites/{id}/seo |
SEO crawler statistics |
GET /websites/{id}/seo/sitemap |
Sitemap coverage data |
GET /websites/{id}/seo/budget-urls |
Per-URL crawl budget breakdown |
GET /websites/{id}/seo/url-patterns |
Auto-detected URL patterns with crawl frequency |
GET /websites/{id}/seo/path-explorer |
Hierarchical directory tree of crawled paths |
GET /websites/{id}/seo/status-consistency |
URLs with inconsistent status codes |
GET /websites/{id}/seo/requests |
Raw crawler request log |
GET /websites/{id}/seo/robots |
Robots.txt analysis |
GET /websites/{id}/seo/sitemap/url-history |
Per-URL crawl history across bots |
GET /websites/{id}/seo/index-coverage |
Google index coverage summary |
GET /websites/{id}/seo/index-coverage/urls |
Index coverage URL drill-down |
GET /websites/{id}/site-events |
Site events and annotations |
GET /websites/{id}/ips/{ip}/requests |
Search requests by IP address |
Authentication
Pass your API key in the Authorization header:
Authorization: Bearer llapi_your_api_key_here
Date Ranges
All endpoints accept a time range. You can either pass hours (e.g. ?hours=168 for the last 7 days) or use start and end for a specific date range in ISO 8601 format:
GET /websites/{id}/bots?start=2026-03-05&end=2026-03-27
GET /websites/{id}/bots?hours=168&split_variants=true
The split_variants parameter is available on the bots endpoint to show Googlebot Desktop and Googlebot Smartphone as separate entries instead of merged.
Rate Limits
The public API is available on Starter and above. Rate limits per plan:
- Free / Basic: no public API access
- Starter: 100 requests/hour
- Growth: 500 requests/hour
- Scale: 2,000 requests/hour
- Enterprise: custom (talk to us)
Full Documentation
For complete API reference with examples, see the API Documentation.
Command-Line Interface (CLI)NEW
Access your LogLens analytics from the terminal. Great for scripting, monitoring, and quick lookups.
Installation
npm install -g @loglens/cli
Setup
# Save your API key
loglens config set-key llapi_your_api_key_here

# Set a default website (optional — skip the -w flag)
loglens config set-website YOUR_WEBSITE_ID
Usage Examples
# List your websites
loglens websites

# Traffic summary for last 24 hours
loglens summary -w <website_id>

# Bot breakdown for last 7 days
loglens bots -w <website_id> -h 168

# Top paths
loglens paths -w <website_id>

# SEO crawler overview
loglens seo overview -w <website_id> --bot googlebot

# Crawl budget by directory
loglens seo budget-urls -w <website_id> --dir /blog/

# URL patterns detection
loglens seo url-patterns -w <website_id> --bot googlebot

# Raw crawler request log
loglens seo requests -w <website_id> --bot googlebot --filter errors

# Query a specific date range
loglens bots -w <website_id> --start 2026-03-05 --end 2026-03-27

# Show Googlebot Desktop and Smartphone separately
loglens bots -w <website_id> --split-variants
Output Formats
Every command supports three output formats:
- Table (default) — formatted, coloured table for reading in the terminal
--json— JSON output, ideal for piping tojqor other tools--csv— CSV output for spreadsheets or further processing
# Export bots as JSON
loglens bots -w <website_id> --json

# Export paths as CSV
loglens paths -w <website_id> --csv > paths.csv

# Pipe to jq
loglens bots -w <website_id> --json | jq '.[].name'
Available Commands
| Command | Description |
|---|---|
loglens websites | List all websites |
loglens summary | Traffic summary |
loglens traffic | Traffic time-series |
loglens bots | Bot and crawler breakdown |
loglens paths | Top URL paths |
loglens geography | Traffic by country |
loglens status-codes | HTTP status code distribution |
loglens ips | Top IP addresses |
loglens ip-requests | Requests from a specific IP |
loglens referrers | Top referrers |
loglens devices | Device breakdown |
loglens seo overview | SEO crawler analytics |
loglens seo sitemap | Sitemap coverage |
loglens seo budget-urls | Crawl budget per URL |
loglens seo url-patterns | URL pattern detection |
loglens seo path-explorer | Directory crawl tree |
loglens seo status-consistency | Inconsistent status codes |
loglens seo requests | Raw crawler request log |
loglens seo robots | Robots.txt analysis |
loglens seo url-history | URL crawl history |
loglens seo index-coverage | Google index coverage |
loglens seo index-urls | Index coverage URLs |
loglens seo events | Site events |
Tip: Run loglens --help or loglens seo --help to see all options for any command.
MCP Server IntegrationNEW
Connect LogLens to AI assistants like Claude, Cursor, and other tools that support the Model Context Protocol (MCP). This lets AI assistants query your analytics data directly — ask questions about your traffic, SEO crawl activity, bot behaviour, and more in natural language.
The LogLens MCP server exposes all 23 public API endpoints as tools that AI assistants can call automatically. No coding required — just connect and start asking questions. All tools support start and end date parameters for querying specific historical ranges, and the bots tool accepts split_variants to separate Googlebot Desktop and Smartphone.
What You Can Do
- Ask "Which bots are crawling my site the most?" and get real data
- Investigate traffic anomalies: "Show me the top IPs hitting 404 errors in the last 24 hours"
- Analyse SEO performance: "What URL patterns are getting the most Googlebot crawls?"
- Debug indexing issues: "Show me the crawl history for /blog/my-post"
- Monitor crawl budget: "How is my crawl budget distributed across directories?"
Setup
First, install the mcp-remote bridge (requires Node.js 18+):
npm install -g mcp-remote
Connecting to Claude Desktop
Add the following to your Claude Desktop configuration file:
macOS: ~/Library/Application Support/Claude/claude_desktop_config.json
Windows: %APPDATA%\Claude\claude_desktop_config.json
{
  "mcpServers": {
    "loglens": {
      "command": "npx",
      "args": [
        "mcp-remote",
        "https://mcp-loglens.com/mcp?apiKey=YOUR_API_KEY"
      ]
    }
  }
}
Replace YOUR_API_KEY with your LogLens API key (found in Organization Settings → API Keys).
Tip: If npx isn't found, use the full path to node and mcp-remote. Run which node and which mcp-remote to find them.
Connecting to Cursor
In Cursor, go to Settings → MCP Servers and add a new server with the URL:
https://mcp-loglens.com/mcp?apiKey=YOUR_API_KEY
Connecting to Other MCP Clients
Any MCP-compatible client can connect using the endpoint:
https://mcp-loglens.com/mcp?apiKey=YOUR_API_KEY
The server supports Streamable HTTP transport. Clients that don't support remote servers directly can use the mcp-remote bridge as shown in the Claude Desktop example above.
Available Tools
The MCP server provides 23 tools covering all LogLens analytics:
| Tool | Description |
|---|---|
list_websites | List all websites in your account |
get_summary | High-level traffic summary |
get_traffic | Traffic time-series data |
get_bots | Bot and crawler breakdown |
get_paths | Top visited URL paths |
get_geography | Traffic by country |
get_status_codes | HTTP status code distribution |
get_ips | Top IP addresses |
get_ip_requests | Requests from a specific IP |
get_referrers | Top referrers |
get_devices | Device type breakdown |
get_seo | SEO crawler analytics overview |
get_sitemap | Sitemap coverage data |
get_budget_urls | Per-URL crawl budget breakdown |
get_url_patterns | Auto-detected URL patterns |
get_path_explorer | Directory tree of crawled paths |
get_status_consistency | URLs with inconsistent status codes |
get_seo_requests | Raw crawler request log |
get_robots | Robots.txt analysis |
get_sitemap_url_history | Per-URL crawl history |
get_index_coverage | Google index coverage summary |
get_index_coverage_urls | Index coverage URL drill-down |
get_site_events | Site events and annotations |
Tip: You need a LogLens API key to connect. Create one in your dashboard under Organization Settings → API Keys.
AWS CloudFront Integration
Send real-time logs from CloudFront to LogLens using Kinesis Data Firehose. This gives you full visibility into all traffic hitting your CloudFront distribution, including bot classification, country-level analytics, and content type breakdowns.
Step 1: Create a Kinesis Data Stream
CloudFront real-time logs are delivered via Kinesis Data Streams. Create one to act as the buffer between CloudFront and Firehose.
- Open the Amazon Kinesis console → Data streams → Create data stream
- Name: e.g.
YourSiteCloudFrontLogs - Capacity mode: On-demand (recommended — scales automatically)
- Click Create data stream
Step 2: Create a Firehose Delivery Stream
Firehose reads from the Kinesis stream and delivers log records to the LogLens ingest endpoint.
- Open the Amazon Data Firehose console → Create Firehose stream
- Source: Amazon Kinesis Data Streams → select the stream from Step 1
- Destination: HTTP Endpoint
- Endpoint URL:
https://km52hdwg42qaoppe3n34tlaneu0wfkjy.lambda-url.eu-west-2.on.aws/(your LogLens ingest endpoint — find this in your LogLens Settings page) - Content encoding: Disabled (do not enable GZIP)
- Under Parameters, add a parameter:
- Key:
X-API-Key - Value: your LogLens API key (starts with
ll_— generate one in LogLens Settings → API Keys)
- Key:
- Buffer conditions: defaults are fine (1 MB / 60 seconds)
- Backup settings: select an S3 bucket to store failed delivery records
- Create or select an IAM role with permission to read from the Kinesis stream
- Click Create Firehose stream
Important: Content encoding must be set to Disabled (not GZIP). Using GZIP can cause delivery issues.
Step 3: Create a CloudFront Real-Time Log Configuration
This tells CloudFront which fields to log and where to send them.
- Open the CloudFront console → Telemetry (left sidebar) → Real-time log configurations → Create configuration
- Name: e.g.
YourSiteRealtimeLogs - Sampling rate: 100 (100% — recommended; reduce for very high-traffic sites)
- Fields: Select all 23 fields listed below
- Endpoint: select the Kinesis data stream from Step 1
- IAM role: create or select a role allowing CloudFront to publish to the Kinesis stream
- Click Create configuration
Required CloudFront Log Fields
You must select all 23 fields when creating the real-time log configuration. Missing fields will result in incomplete data or failed parsing.
timestamp
c-ip
time-to-first-byte
sc-status
sc-bytes
cs-method
cs-protocol
cs-host
cs-uri-stem
cs-bytes
x-edge-location
x-edge-request-id
x-host-header
time-taken
cs-protocol-version
cs-user-agent
cs-referer
cs-cookie
x-edge-response-result-type
x-edge-result-type
sc-content-type
c-port
c-country
The easiest approach is to click "Select all" in the field picker, which selects all available fields including these 23.
Step 4: Attach to Your CloudFront Distribution
- Open your CloudFront distribution
- Go to the Behaviors tab
- Edit the default behavior (or whichever behavior you want to monitor)
- Under Real-time log configuration, select the configuration from Step 3
- Save changes
Data will start appearing in your LogLens dashboard within a few minutes.
Required IAM Permissions
You'll need two IAM roles:
- CloudFront → Kinesis: Allows CloudFront to write to your Kinesis Data Stream (
kinesis:PutRecord,kinesis:PutRecords) - Firehose → Kinesis + HTTP: Allows Firehose to read from Kinesis (
kinesis:GetRecords,kinesis:GetShardIterator,kinesis:DescribeStream) and deliver to the HTTP endpoint
AWS will prompt you to create these roles during setup if they don't exist.
Troubleshooting
- No data appearing: Check the Firehose Monitoring tab in AWS Console — look for
DeliveryToHttpEndpoint.Successmetrics. If you see failures, check the error S3 bucket. - Delivery failures: Verify your API key is correct and active in LogLens Settings → API Keys. Ensure content encoding is set to Disabled (not GZIP).
- Partial data: Make sure all 23 required fields are selected in the real-time log configuration. Missing fields cause records to be silently dropped.
Cloudflare Integration
Forward logs from Cloudflare using Workers.
Cloudflare Worker Setup
Create a Cloudflare Worker that:
- Intercepts requests to your site
- Extracts log data (path, method, status, etc.)
- Forwards to the LogLens API
Sample Worker Code
addEventListener('fetch', event => {
  event.respondWith(handleRequest(event.request))
})

async function handleRequest(request) {
  const response = await fetch(request)

  // Send log to LogLens (non-blocking)
  event.waitUntil(sendToLogLens(request, response))

  return response
}
Use event.waitUntil() to send logs asynchronously without slowing down the response.
Vercel IntegrationNEW
Send logs from Vercel-hosted sites using Vercel Drains. This integration captures all traffic to your Vercel deployments with minimal setup.
Perfect for Next.js, React, and other frameworks hosted on Vercel.
Setup Overview
- Create a Vercel-type website in LogLens
- Configure a new Drain in your Vercel project settings
- Enter the LogLens endpoint URL and signing secret
- Logs start flowing within seconds
Step 1: Create a Vercel Website in LogLens
- Log into LogLens
- Click the website dropdown and select "Add Website"
- Enter your website name and domain
- Select Vercel as the source type
- Click "Create Website"
- Copy the Endpoint URL and Signing Secret shown in the setup instructions
Save your signing secret in a secure place. You'll need it when configuring the Vercel Drain.
Step 2: Configure Vercel Drain
- Go to your Vercel Dashboard
- Navigate to Settings → Observability → Drains
- Click Create Drain
- Select the data to drain:
- Check Logs (required)
- Configure drain settings:
- Projects: Select "All Projects" or specific projects
- Sources: Select all sources (Edge, Lambda, Static, Build, External)
- Environments: Select environments to monitor (Production, Preview, Development)
- Click Next to proceed to destination configuration
Step 3: Set Destination
- Select HTTP as the delivery method
- Enter the LogLens endpoint URL from Step 1
- Enter the signing secret from Step 1
- Leave other settings at their defaults
- Click Create Drain to finish
Verification
After creating the drain:
- Visit your Vercel-hosted site to generate some traffic
- Return to LogLens within 1-2 minutes
- You should see requests appearing in your dashboard
What Data is Captured
Vercel Drains send comprehensive request data including:
- Request path, method, and query string
- Response status code
- Client IP address and country
- User agent string
- Response size in bytes
- Cache status (HIT, MISS, STALE, etc.)
- Edge region where request was served
Vercel vs Other Integrations
Key differences when using Vercel:
- No API keys needed — Vercel uses HMAC signature verification instead
- Automatic setup — No infrastructure to configure (unlike CloudFront)
- All traffic captured — Including serverless functions and edge middleware
Vercel Drains are included in all Vercel plans, including the free Hobby tier.
Apache / Nginx via VectorNEW
Stream access logs from Apache or Nginx servers to LogLens using the Vector agent. This is the right integration for sites that are not behind a CDN — VPS, dedicated, or cPanel-style hosting where the web server writes access logs directly to disk.
Setup time: about 10 minutes. Works with the standard Combined Log Format out of the box.
Overview
Vector tails your access log file, parses each line with its built-in parse_apache_log() or parse_nginx_log() VRL function, batches the events as gzipped NDJSON, and posts them to the LogLens /v1/ingest/vector endpoint using a per-site Bearer token.
Prerequisites
- A Linux server with
sudoaccess (Debian / Ubuntu / RHEL / CentOS / Amazon Linux) - Outbound HTTPS (port 443) to
api.loglens.ai - A reachable access log file. Common paths:
- Nginx (any distro):
/var/log/nginx/access.log - Apache on Debian / Ubuntu:
/var/log/apache2/access.log - Apache on RHEL / CentOS / Amazon Linux:
/var/log/httpd/access_log(note:access_logwith an underscore, no.logsuffix)
- Nginx (any distro):
- A LogLens account with an organization that can add a website
Step 1: Install Vector
Pick the install path that matches your distribution. Vector is a single static binary with no runtime dependencies.
Debian / Ubuntu (apt):
curl -1sLf 'https://repositories.timber.io/public/vector/setup.deb.sh' | sudo -E bash
sudo apt-get install -y vector
RHEL / CentOS / Amazon Linux (yum):
curl -1sLf 'https://repositories.timber.io/public/vector/setup.rpm.sh' | sudo -E bash
sudo yum install -y vector
Static binary (any Linux):
curl --proto '=https' --tlsv1.2 -sSfL https://sh.vector.dev | bash
# Then add ~/.vector/bin to your PATH, or move the binary to /usr/local/bin
Verify the install:
vector --version
Step 2: Get your ingest config
- Log into LogLens
- Click the website dropdown and select "Add website"
- Choose Apache / Nginx (Vector) as the source type
- Enter your site name and domain, then click "Generate config"
- Download the pre-filled
vector.yamlfile
The ingest token is shown once and is embedded directly in the downloaded vector.yaml. Save the file somewhere safe. If you lose it, regenerate the token from the website settings page.
Step 3: Drop in the config
Move the downloaded config into Vector's config directory and lock down its permissions (it contains your Bearer token):
sudo mkdir -p /etc/vector
sudo mv vector.yaml /etc/vector/vector.yaml
sudo chmod 600 /etc/vector/vector.yaml
Grant Vector permission to read the access log. On Ubuntu / Debian, the simplest path is to add the vector system user to the adm group, which owns /var/log on most setups:
sudo usermod -aG adm vector
Alternatively, make the log file world-readable (less ideal, but works on any distro):
sudo chmod 644 /var/log/nginx/access.log
# Apache on Debian / Ubuntu:
sudo chmod 644 /var/log/apache2/access.log
# Apache on RHEL / CentOS / Amazon Linux:
sudo chmod 644 /var/log/httpd/access_log
Step 4: Start the service
sudo systemctl enable --now vector
Tail Vector's own logs to confirm it started cleanly and is shipping events:
sudo journalctl -u vector -f
Step 5: Verify
- Return to the LogLens dashboard and open the website you just added
- Click "Test connection" on the setup page
- Generate a little traffic (refresh your homepage, hit a couple of URLs)
- Switch to the live view — events should appear within about 30 seconds
Vector batches events for efficiency. If you have very low traffic, you may need to wait up to a minute for the first batch to flush.
Troubleshooting
| Symptom | What to check |
|---|---|
| Vector won't start | Inspect the service log: sudo journalctl -u vector --since '5 min ago'. Most failures are YAML parse errors or missing log file paths. |
| "Permission denied" reading the access log | Add the Vector user to the adm group (sudo usermod -aG adm vector) or chmod the log file to 644. On SELinux systems: sudo semanage permissive -a vector_t, or follow Vector's SELinux setup guide. |
| "Connection refused" or timeout in Vector logs | An outbound firewall is blocking port 443 to api.loglens.ai. Test the path with curl -I https://api.loglens.ai/v1/health — you should get a 200 response. |
| 401 or 403 responses logged by Vector | The ingest token is wrong, revoked, or doesn't match the site. Regenerate it from the website settings page in the dashboard and replace the token: value in /etc/vector/vector.yaml, then sudo systemctl restart vector. |
| Events appear in the wrong day or hour ("time skew") | The server clock is off. Install and enable a time sync daemon: sudo apt install chrony (or use systemd-timesyncd). Verify with timedatectl status. |
| Custom log format — parser fails on every line | The default config assumes Combined Log Format. If your LogFormat directive differs, edit the VRL transforms block in vector.yaml and swap parse_apache_log() / parse_nginx_log() for parse_regex() with a pattern that matches your format. |
The same Vector agent can ship logs from multiple sites on the same server — just add additional sources and sinks entries to vector.yaml, each with its own LogLens token.
Google Search ConsoleNEW
Connect your Google Search Console account to correlate server log data with indexing status and search performance metrics.
Connect your GSC to correlate crawl data with indexing status and search performance.
Connecting
- Go to Settings → Integrations
- Click "Connect Google Search Console"
- Authorize with Google (LogLens requests read-only access)
- Select your GSC property (domain or URL-prefix)
- Initial sync starts automatically
What Data is Synced
- Index status per URL — Indexed or not indexed, with reason
- Search impressions & clicks — Last 28 days of search performance
- Average search position — Per URL ranking data
- Top search queries — Queries driving traffic to high-impression URLs
- Canonical URL selection — Google's chosen canonical for each URL
Automatic Syncs
- Runs daily at 5 AM UTC
- Manual "Sync Now" button available in Settings → Integrations
- Search analytics data is 2-3 days behind real-time
- URL inspection results are cached for 7 days
URL Inspection Priority
- Highest-impression URLs are inspected first
- Up to 500 URLs per sync run
- URLs are re-inspected after 7 days
Disconnecting
Go to Settings → Integrations and click "Disconnect" next to Google Search Console. Cached data will expire automatically.
LogLens uses read-only access to your Search Console data. It cannot modify any settings or submit URLs.
You need at least "Read" permission on the GSC property. The property must be verified (domain or URL-prefix).
Import Logs
Upload historical log files to backfill your analytics. LogLens auto-detects CloudFront, Apache, Nginx, and Screaming Frog formats. See Historical Log Import for full details on the import process, deduplication, completion emails, and progress tracking.
Supported Formats
- CloudFront Standard Logs — Default CloudFront access log format (.gz)
- CloudFront Real-Time Logs — Real-time log format used with Kinesis Firehose
- Apache and Nginx access logs — combined and common formats
- Screaming Frog Events CSV — the Events export from Screaming Frog Log File Analyser, deduplicated against your existing data
How to Import
- Go to Import Logs in the Tools section of the sidebar
- Drag and drop your log file or click to browse
- The format is detected automatically
- Processing begins and progress is tracked in real-time
Import Status
Track the status of your imports:
- Pending — Queued for processing
- Processing — Currently being analyzed
- Completed — Successfully imported
- Failed — Error during import
Deduplication
LogLens automatically deduplicates imported logs. Importing the same file twice will not create duplicate records. See Historical Log Import for details.
Large log files may take several minutes to process. You can navigate away and check back later.
Website Settings
Configure settings for each website in your account.
General Settings
- Website Name — Friendly name shown in the UI
- Domain — Primary domain for this website
API Keys
Manage API keys for log ingestion:
- View existing API keys
- Generate new API keys
- Revoke compromised keys
Keep your API keys secret. If a key is compromised, revoke it immediately and generate a new one.
Organization Settings
Manage your organization and billing.
Organization Details
- Organization Name — Your company or team name
- Plan — Current subscription tier
- Usage — Requests used this billing period
Billing
View and manage your subscription, update payment methods, and download invoices.
Team Management
Invite team members and manage permissions.
Roles
| Role | Permissions |
|---|---|
| Owner | Full access, billing, can delete organization |
| Admin | Manage websites, team members, settings |
| Member | View analytics, manage assigned websites |
| Viewer | View-only access to analytics |
Inviting Team Members
- Go to Organization Settings
- Click "Invite Member"
- Enter their email address
- Select a role
- They'll receive an email invitation to join
Privacy ModeNEW
Privacy Mode helps you share screenshots without revealing sensitive information.
Perfect for sharing screenshots in documentation, bug reports, or social media without exposing your domains.
What Gets Obscured
When Privacy Mode is enabled:
- Domain names — Website names are replaced with placeholders
- Path segments — Partial path data is obscured
- Organization details — Organization name and user info are hidden
How to Enable
- Click on your profile/settings in the bottom-left corner
- Toggle "Privacy Mode" on
- The interface will immediately update to show obscured data
- Take your screenshots
- Toggle Privacy Mode off to return to normal view
Privacy Mode only affects the display—your actual data remains unchanged and will appear normally when Privacy Mode is turned off.
AI InsightsNEW
AI Insights uses Claude to automatically analyse your analytics data and surface actionable findings about your traffic, bots, SEO performance, and more.
Get AI-powered analysis of your analytics data without writing queries or building reports.
How to Access
Click the AI Insights panel available on any analytics page. The panel opens alongside your current view so you can see insights in context with your data.
What It Analyses
AI Insights can analyse a wide range of data depending on the page you are viewing:
- Traffic patterns — Unusual spikes, drops, or trends in request volume
- Bot behaviour — Crawler patterns, verification anomalies, and suspicious activity
- SEO performance — Crawl coverage, indexing gaps, and optimisation opportunities
- Status codes — Error rate trends, broken links, and server issues
- Geographic patterns — Traffic distribution anomalies across regions
- Path analysis — High-traffic pages, slow responses, and content performance
Filter-Scoped Insights
Insights automatically adapt to your current page and active filters. For example, if you are on the SEO page filtered to Googlebot, the AI will generate insights specifically about Googlebot's crawl behaviour. Switch to the Bots page filtered to a specific bot, and insights will focus on that bot's activity patterns.
Saved Insights
Every insight is saved and can be viewed later for the same page and filter combination. This lets you track how your analytics evolve over time without regenerating insights.
Tool Activity
While generating insights, the AI Insights panel shows which data the AI is querying in real-time. You can see exactly which analytics endpoints and data sources are being accessed, providing full transparency into the analysis process.
Dashboard Links
Insights include clickable links to relevant reports and pages within LogLens. This lets you quickly navigate to the underlying data to verify findings or investigate further.
Insight Format
Each insight is presented as a card with three sections:
- Key Takeaways — A concise summary of the most important findings
- Detailed Analysis — In-depth explanation of patterns, anomalies, and context
- Recommendations — Specific actions you can take based on the findings
Generate insights after changing your time filter or applying new filters to get analysis tailored to the exact data you are looking at.
Insights HistoryNEW
The Insights History page shows all AI-generated insights across every page and filter combination, in one place.
Review and manage all your past AI insights from a single dedicated page.
Viewing Past Insights
Navigate to the Insights History page from the Tools section in the sidebar. All previously generated insights are listed in reverse chronological order.
Filtering by Page
Use the page filter to narrow the list to insights generated on a specific section, such as Traffic, Bots, SEO, or any other analytics page.
Expandable Insight Cards
Each insight is shown as a collapsible card. Click to expand and view the full content including Key Takeaways, Detailed Analysis, and Recommendations.
Token Usage Tracking
Each insight card displays the number of tokens used during generation, so you can monitor your AI usage over time.
Deleting Insights
To remove an insight, click the delete button on any individual insight card. Deleted insights cannot be recovered.
Use Insights History to compare how your analytics have changed over time by reviewing insights generated on different dates for the same page.
RecommendationsNEW
The Recommendations page surfaces actionable findings from your logs — the IPs you should probably block, the broken paths your visitors are hitting, the bots impersonating Googlebot, and the URLs your users are waiting on. Everything is one click away from a fix.
Stop hunting for problems in raw analytics. Recommendations does the triage for you and lets you action items in bulk.
The four tabs
- IPs to block — Suspicious or scanning IPs ranked by request volume, error rate, and probe-like behaviour. Each row shows the IP, country, request count, and the signals that flagged it.
- 404s to fix — Paths returning 404 with hit counts, so you can prioritise redirects or content fixes by impact rather than by guesswork.
- Unverified bots — Clients claiming to be a known crawler (Googlebot, GPTBot, ClaudeBot, etc.) whose IP doesn’t match the operator’s official ranges. See Bot Verification for the full mechanism.
- Slow paths — URLs whose response times exceed the latency threshold, with median and p95 timings to help you triage performance regressions.
Time-picker driven
The page-header time picker controls every tab. Switch from “Last 24 hours” to “Last 7 days” and the lists, counts, and exports all re-scope automatically. Each tab also shows a period-aware empty state when there’s genuinely nothing to action in the selected window.
Sortable columns
Every table has sortable columns with a 3-state cycle — click a header to sort descending, click again for ascending, click a third time to clear. Useful for “show me the highest-volume 404s” or “show me the slowest paths by p95” without changing tabs.
Country flags
Tables that include a country column (IPs to block, Unverified bots) show the flag inline next to the country code. Hover any flag for a tooltip with the full country name.
Multi-select and bulk resolve
- Tick the checkboxes on individual rows, or use the header checkbox to select everything on the page.
- Click “Resolve selected” to mark items as actioned — they drop off the list and the counter updates immediately.
- Resolutions are remembered, so the same IP or path won’t reappear on the next refresh unless it generates new activity.
Stale selections (rows that vanish because the time window changed) are pruned automatically, so “Resolve selected” only ever acts on items still visible.
Per-tab CSV exports
Each tab has its own export controls:
- Export this page — Instant download of the rows currently displayed.
- Export all data — Queues a background job that fetches the entire result set for the active tab and writes the CSV to your Downloads page when ready. Use this for big datasets where pagination would otherwise force you to export piece-by-piece.
Filenames include the site domain so multi-site exports stay organised — e.g. example.com-recommendations-404s-7d.csv.
Athena timeouts
Some recommendation queries (especially over long time ranges) run on Athena and can occasionally time out. When that happens you’ll see a clear empty-state message explaining the timeout, with a suggestion to narrow the time range or retry — rather than a confusing “no results”.
Start each week on the Recommendations page. Working through one tab at a time is the quickest way to keep your site clean and your analytics clean of noise.
Historical Log ImportNEW
Import historical log files to backfill your analytics with past data. Access this feature from Import Logs in the Tools section of the sidebar.
Backfill your analytics with historical data by uploading log files directly.
Supported Formats
LogLens supports the following formats, all auto-detected on upload — you don’t need to pick one:
- CloudFront Standard Logs — The default CloudFront access log format (tab-separated, usually .gz compressed)
- CloudFront Real-Time Logs — The real-time log format used with Kinesis Firehose
- Apache access logs — Combined and Common Log Format
- Nginx access logs — Default and combined formats
- Screaming Frog Events CSV — The “Events” export from Screaming Frog Log File Analyser. Drop the CSV in and LogLens detects the column layout automatically.
Upload Process
- Navigate to Import Logs in the Tools section
- Drag and drop your log file or click to browse and select it
- The file is uploaded and processing begins automatically
- Monitor progress as the file is processed
- Once complete, the imported data appears in your analytics and a confirmation email is sent
Deduplication
LogLens uses deterministic request IDs to prevent duplicate records. If you import the same log file twice, or if the imported data overlaps with logs already received via real-time ingestion (or with a previous Screaming Frog export covering the same window), duplicate entries are automatically detected and skipped. This means you can safely re-import files without worrying about inflating your analytics.
Progress Tracking
Each import job displays detailed progress with the following counts:
- Processed — Total log entries parsed from the file
- New — Entries successfully added to your analytics
- Duplicates — Entries that already existed and were skipped
- Failed — Entries that could not be parsed or stored
Completion email
When an import finishes, LogLens emails you a summary with the four counts above and a link straight to the affected site’s dashboard. You don’t need to keep the import page open while a large file processes.
After Import
Imported data appears in all analytics pages — Traffic, Bots, Paths, IPs, Geography, and more. It is treated identically to real-time data once imported.
Large log files may take several minutes to process. You can navigate away from the page and check back later — processing continues in the background and the completion email will reach you when it’s done.
DownloadsNEW
Export your analytics data as CSV files from any analytics page, and manage your export history from the Downloads page.
Export data from any analytics page for offline analysis, reporting, or integration with other tools.
How to Export
Every analytics page with a data table includes a download button. Click it to export the current data as a CSV file.
Available Export Pages
CSV export is available on the following pages:
- Traffic — Time-series traffic data
- Bots — Bot list with request counts and verification status
- Paths — URL paths with request counts and metrics
- IPs — IP addresses and ranges with request counts
- Referrers — Referring domains with traffic counts
- Geography — Country-level traffic breakdown
- Devices — Device, browser, and OS breakdown
- Status Codes — HTTP status code distribution
Download Button Location
The download button is located in the header area of each page, typically next to the page title or above the data table. Look for the download icon or "Export CSV" button.
Downloads Page
The Downloads page in the Tools section of the sidebar shows your complete export history. From here you can:
- View all past exports with timestamps and file sizes
- Re-download previously generated CSV files
- See the status of exports currently being generated
Exports respect your current filters. Apply time period, country, or other filters before exporting to get exactly the data you need.
AI HelperNEW
The AI Helper is a chat bubble in the bottom-right corner of every LogLens page — the marketing site, the help docs, and inside the app. Ask it a product question and it answers instantly using the same documentation you’re reading now.
Get answers to product questions without leaving the page — and hand off to a human with full conversation context if you need to.
What it can do
- Answer how-to questions (“how do I set up CloudFront?”, “what does verified bot mean?”).
- Explain dashboard concepts and walk you through specific features.
- Point you at the right help section, API endpoint, or settings page.
- Help you debug ingestion issues by walking through the most common causes.
Handing off to a human
If the AI can’t solve it — or if you’d rather talk to a person — ask it to escalate, or click the “Talk to a human” option in the chat. Your full conversation transcript is forwarded to support, so you don’t have to repeat yourself. We reply by email.
Where it lives
- Bottom-right of every marketing page (loglens.ai), help page, and changelog page.
- Bottom-right of every page inside the dashboard (app.loglens.ai).
- On this Help page, the chat also mounts inline inside the “Ask AI” box at the top — type a question there and the answer appears in place.
The AI sees the public docs — not your account data. Asking “why are my logs missing?” will get you generic troubleshooting steps; for account-specific issues, hand off to a human and we’ll dig in.
Status PageNEW
The public LogLens status page lives at loglens.ai/status. It shows the real-time health of every LogLens subsystem — ingestion, dashboard API, alerting, exports, and more — plus a 90-day uptime history and a timeline of recent incidents.
Bookmark the status page or subscribe to its RSS feed to be the first to know about any service-affecting issues.
What you’ll find there
- Per-subsystem status — current state of ingestion, API, dashboard, alerting, exports, integrations, and more.
- 90-day uptime bars — a quick visual of which days had incidents and which were clean.
- Incident timeline — full history of past incidents with start/end times, scope, and post-incident notes.
- RSS feed — subscribe at loglens.ai/status/rss.xml to get incident updates in your RSS reader, Slack, or any tool that consumes RSS.
ChangelogNEW
Every feature, improvement, and fix we ship is announced on the public changelog at loglens.ai/changelog. New features, performance improvements, bug fixes, and UI refreshes all show up there in reverse chronological order.
Subscribe to the changelog RSS feed to keep up with what’s new without having to check back manually.
What’s included
- Features — brand-new capabilities, integrations, and dashboard panels.
- Improvements — enhancements to existing features and performance work.
- Fixes — bug fixes worth knowing about, with enough detail to tell whether you were affected.
RSS feed
Subscribe at loglens.ai/changelog/rss.xml to get every changelog entry delivered to your RSS reader.