Public status page at loglens.ai/status
A live public status dashboard showing the health of every LogLens subsystem — web, ingestion, dashboards, background jobs, notifications — plus active and recent incidents.
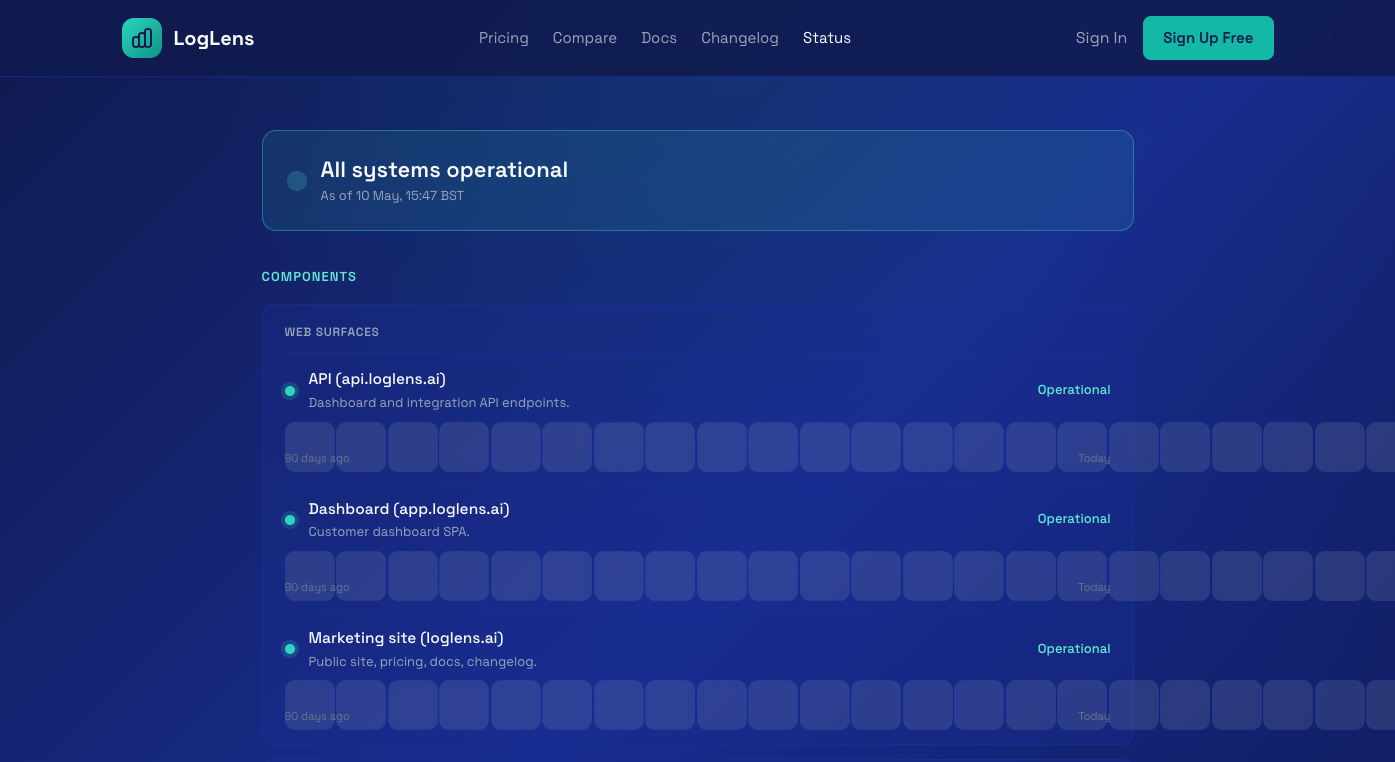
loglens.ai/status is live. Every minute we run a health check across twelve subsystems — the marketing site, the dashboard, the API, log ingestion, metrics aggregation, the long-term archive, imports, sitemap fetching, anomaly detection, AI insights, email delivery and Stripe webhooks — and the page renders the result in real time.
What you'll see there:
- A headline status banner ("All systems operational" or the kind of language you don't want to see).
- Each subsystem with its current status and a 90-day uptime bar.
- Active incidents at the top with a public message and timeline of updates.
- Past incidents from the last 30 days at the bottom.
Behind the scenes, every fail-then-recover transition emails our admin team, and we can manually open or update incidents (planned maintenance announcements, narrative updates during a fire) without a deploy.
The page polls every 30 seconds and is also available as an RSS feed if you'd rather subscribe.